Liberian vs Danish Unemployment
COMPARE
Liberian
Danish
Unemployment
Unemployment Comparison
Liberians
Danes
5.6%
UNEMPLOYMENT
0.9/ 100
METRIC RATING
248th/ 347
METRIC RANK
4.3%
UNEMPLOYMENT
100.0/ 100
METRIC RATING
4th/ 347
METRIC RANK
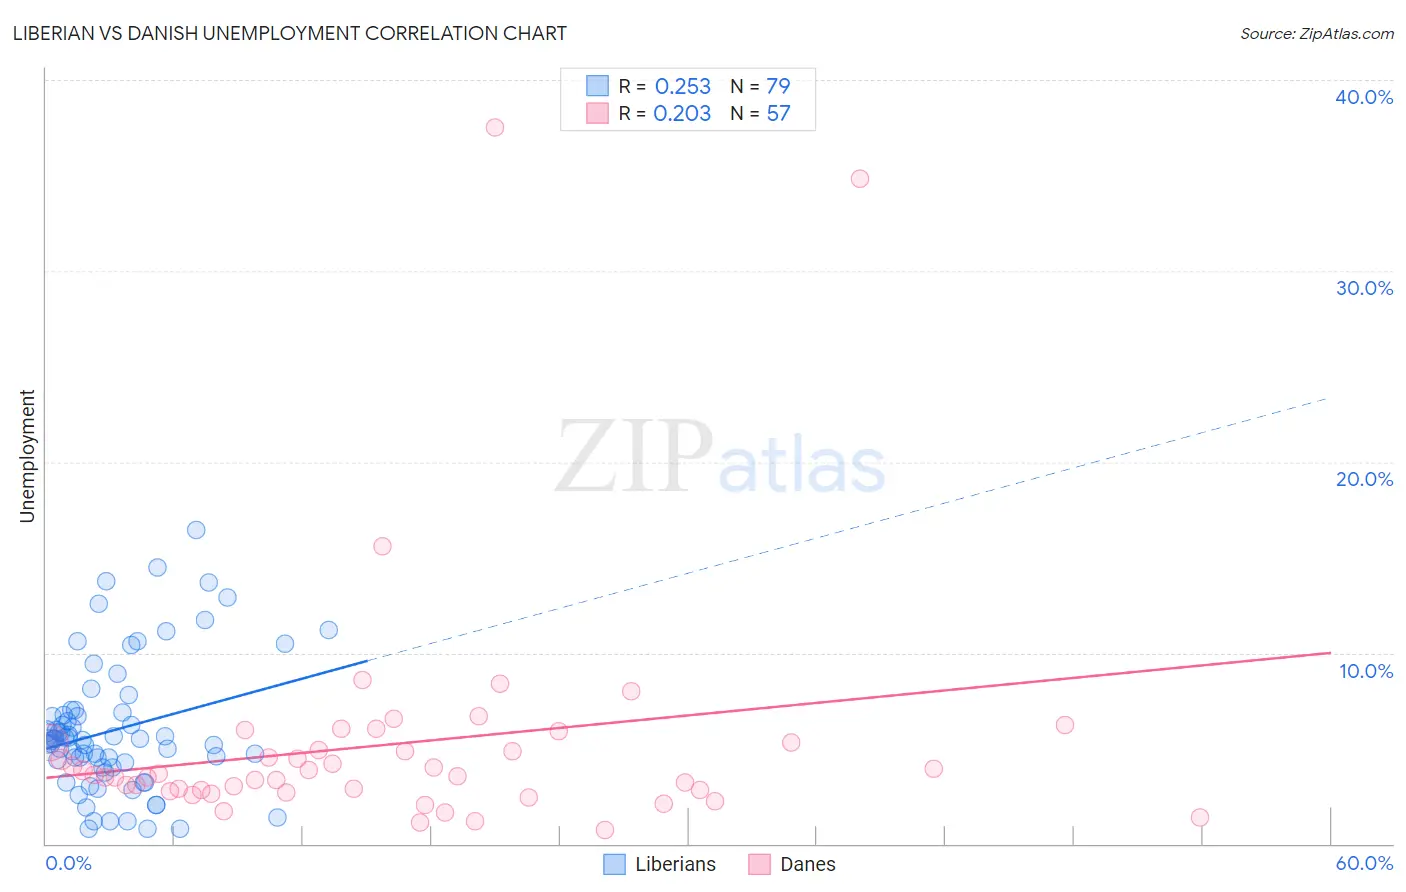
Liberian vs Danish Unemployment Correlation Chart
The statistical analysis conducted on geographies consisting of 118,076,237 people shows a weak positive correlation between the proportion of Liberians and unemployment in the United States with a correlation coefficient (R) of 0.253 and weighted average of 5.6%. Similarly, the statistical analysis conducted on geographies consisting of 472,550,686 people shows a weak positive correlation between the proportion of Danes and unemployment in the United States with a correlation coefficient (R) of 0.203 and weighted average of 4.3%, a difference of 29.5%.
Unemployment Correlation Summary
| Measurement | Liberian | Danish |
| Minimum | 0.80% | 0.70% |
| Maximum | 16.4% | 37.5% |
| Range | 15.6% | 36.8% |
| Mean | 6.0% | 5.2% |
| Median | 5.5% | 3.6% |
| Interquartile 25% (IQ1) | 4.0% | 2.8% |
| Interquartile 75% (IQ3) | 6.9% | 5.3% |
| Interquartile Range (IQR) | 2.9% | 2.5% |
| Standard Deviation (Sample) | 3.4% | 6.4% |
| Standard Deviation (Population) | 3.4% | 6.3% |
Similar Demographics by Unemployment
Demographics Similar to Liberians by Unemployment
In terms of unemployment, the demographic groups most similar to Liberians are Immigrants from Cameroon (5.6%, a difference of 0.13%), Cajun (5.6%, a difference of 0.26%), Japanese (5.6%, a difference of 0.27%), Bermudan (5.6%, a difference of 0.28%), and French American Indian (5.6%, a difference of 0.32%).
| Demographics | Rating | Rank | Unemployment |
| Tlingit-Haida | 2.0 /100 | #241 | Tragic 5.6% |
| Spanish Americans | 2.0 /100 | #242 | Tragic 5.6% |
| Marshallese | 1.3 /100 | #243 | Tragic 5.6% |
| Dutch West Indians | 1.2 /100 | #244 | Tragic 5.6% |
| French American Indians | 1.2 /100 | #245 | Tragic 5.6% |
| Bermudans | 1.1 /100 | #246 | Tragic 5.6% |
| Immigrants | Cameroon | 1.0 /100 | #247 | Tragic 5.6% |
| Liberians | 0.9 /100 | #248 | Tragic 5.6% |
| Cajuns | 0.8 /100 | #249 | Tragic 5.6% |
| Japanese | 0.8 /100 | #250 | Tragic 5.6% |
| Kiowa | 0.6 /100 | #251 | Tragic 5.7% |
| Hondurans | 0.3 /100 | #252 | Tragic 5.7% |
| Central Americans | 0.3 /100 | #253 | Tragic 5.7% |
| Immigrants | Honduras | 0.3 /100 | #254 | Tragic 5.7% |
| Immigrants | Portugal | 0.2 /100 | #255 | Tragic 5.7% |
Demographics Similar to Danes by Unemployment
In terms of unemployment, the demographic groups most similar to Danes are Czech (4.3%, a difference of 0.15%), Luxembourger (4.3%, a difference of 0.25%), Swedish (4.4%, a difference of 2.3%), German (4.5%, a difference of 3.1%), and Norwegian (4.2%, a difference of 3.6%).
| Demographics | Rating | Rank | Unemployment |
| Norwegians | 100.0 /100 | #1 | Exceptional 4.2% |
| Luxembourgers | 100.0 /100 | #2 | Exceptional 4.3% |
| Czechs | 100.0 /100 | #3 | Exceptional 4.3% |
| Danes | 100.0 /100 | #4 | Exceptional 4.3% |
| Swedes | 100.0 /100 | #5 | Exceptional 4.4% |
| Germans | 100.0 /100 | #6 | Exceptional 4.5% |
| Immigrants | India | 100.0 /100 | #7 | Exceptional 4.5% |
| Swiss | 100.0 /100 | #8 | Exceptional 4.5% |
| Scandinavians | 100.0 /100 | #9 | Exceptional 4.5% |
| Dutch | 100.0 /100 | #10 | Exceptional 4.6% |
| English | 100.0 /100 | #11 | Exceptional 4.6% |
| Pennsylvania Germans | 100.0 /100 | #12 | Exceptional 4.6% |
| Belgians | 100.0 /100 | #13 | Exceptional 4.6% |
| Immigrants | Cuba | 100.0 /100 | #14 | Exceptional 4.6% |
| Europeans | 99.9 /100 | #15 | Exceptional 4.6% |