West Indian vs Cree Unemployment
COMPARE
West Indian
Cree
Unemployment
Unemployment Comparison
West Indians
Cree
6.4%
UNEMPLOYMENT
0.0/ 100
METRIC RATING
302nd/ 347
METRIC RANK
5.6%
UNEMPLOYMENT
2.6/ 100
METRIC RATING
240th/ 347
METRIC RANK
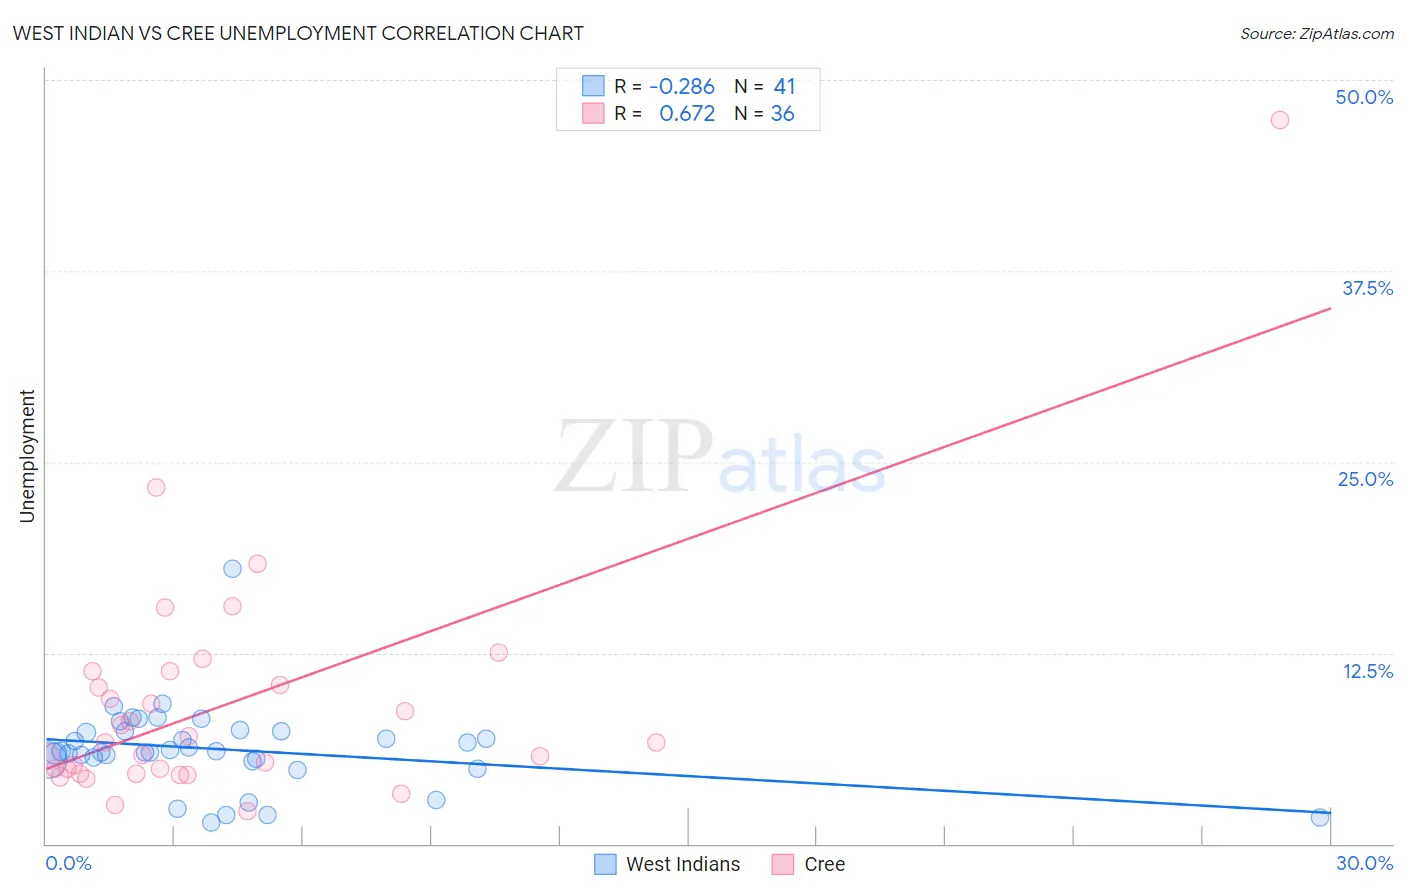
West Indian vs Cree Unemployment Correlation Chart
The statistical analysis conducted on geographies consisting of 253,931,016 people shows a weak negative correlation between the proportion of West Indians and unemployment in the United States with a correlation coefficient (R) of -0.286 and weighted average of 6.4%. Similarly, the statistical analysis conducted on geographies consisting of 76,166,078 people shows a significant positive correlation between the proportion of Cree and unemployment in the United States with a correlation coefficient (R) of 0.672 and weighted average of 5.6%, a difference of 14.6%.
Unemployment Correlation Summary
| Measurement | West Indian | Cree |
| Minimum | 1.4% | 2.1% |
| Maximum | 18.0% | 47.4% |
| Range | 16.6% | 45.3% |
| Mean | 6.2% | 9.1% |
| Median | 6.0% | 6.6% |
| Interquartile 25% (IQ1) | 5.5% | 4.7% |
| Interquartile 75% (IQ3) | 7.4% | 10.8% |
| Interquartile Range (IQR) | 1.9% | 6.1% |
| Standard Deviation (Sample) | 2.8% | 8.0% |
| Standard Deviation (Population) | 2.7% | 7.9% |
Similar Demographics by Unemployment
Demographics Similar to West Indians by Unemployment
In terms of unemployment, the demographic groups most similar to West Indians are Belizean (6.4%, a difference of 0.23%), Trinidadian and Tobagonian (6.3%, a difference of 0.25%), Immigrants from Trinidad and Tobago (6.3%, a difference of 0.74%), Immigrants from West Indies (6.3%, a difference of 0.86%), and Immigrants from Haiti (6.3%, a difference of 0.90%).
| Demographics | Rating | Rank | Unemployment |
| U.S. Virgin Islanders | 0.0 /100 | #295 | Tragic 6.3% |
| Ute | 0.0 /100 | #296 | Tragic 6.3% |
| Jamaicans | 0.0 /100 | #297 | Tragic 6.3% |
| Immigrants | Haiti | 0.0 /100 | #298 | Tragic 6.3% |
| Immigrants | West Indies | 0.0 /100 | #299 | Tragic 6.3% |
| Immigrants | Trinidad and Tobago | 0.0 /100 | #300 | Tragic 6.3% |
| Trinidadians and Tobagonians | 0.0 /100 | #301 | Tragic 6.3% |
| West Indians | 0.0 /100 | #302 | Tragic 6.4% |
| Belizeans | 0.0 /100 | #303 | Tragic 6.4% |
| Immigrants | Jamaica | 0.0 /100 | #304 | Tragic 6.4% |
| Menominee | 0.0 /100 | #305 | Tragic 6.4% |
| Lumbee | 0.0 /100 | #306 | Tragic 6.4% |
| Immigrants | Bangladesh | 0.0 /100 | #307 | Tragic 6.5% |
| Barbadians | 0.0 /100 | #308 | Tragic 6.5% |
| Vietnamese | 0.0 /100 | #309 | Tragic 6.5% |
Demographics Similar to Cree by Unemployment
In terms of unemployment, the demographic groups most similar to Cree are Immigrants (5.5%, a difference of 0.010%), Immigrants from Western Asia (5.5%, a difference of 0.10%), Moroccan (5.5%, a difference of 0.31%), Tlingit-Haida (5.6%, a difference of 0.34%), and Spanish American (5.6%, a difference of 0.35%).
| Demographics | Rating | Rank | Unemployment |
| Immigrants | Syria | 4.8 /100 | #233 | Tragic 5.5% |
| Panamanians | 4.7 /100 | #234 | Tragic 5.5% |
| Immigrants | Panama | 3.4 /100 | #235 | Tragic 5.5% |
| Immigrants | Cambodia | 3.3 /100 | #236 | Tragic 5.5% |
| Moroccans | 3.2 /100 | #237 | Tragic 5.5% |
| Immigrants | Western Asia | 2.8 /100 | #238 | Tragic 5.5% |
| Immigrants | Immigrants | 2.6 /100 | #239 | Tragic 5.5% |
| Cree | 2.6 /100 | #240 | Tragic 5.6% |
| Tlingit-Haida | 2.0 /100 | #241 | Tragic 5.6% |
| Spanish Americans | 2.0 /100 | #242 | Tragic 5.6% |
| Marshallese | 1.3 /100 | #243 | Tragic 5.6% |
| Dutch West Indians | 1.2 /100 | #244 | Tragic 5.6% |
| French American Indians | 1.2 /100 | #245 | Tragic 5.6% |
| Bermudans | 1.1 /100 | #246 | Tragic 5.6% |
| Immigrants | Cameroon | 1.0 /100 | #247 | Tragic 5.6% |