Liberian vs Cree Disability Age Over 75
COMPARE
Liberian
Cree
Disability Age Over 75
Disability Age Over 75 Comparison
Liberians
Cree
48.0%
DISABILITY AGE OVER 75
6.7/ 100
METRIC RATING
224th/ 347
METRIC RANK
48.2%
DISABILITY AGE OVER 75
4.2/ 100
METRIC RATING
233rd/ 347
METRIC RANK
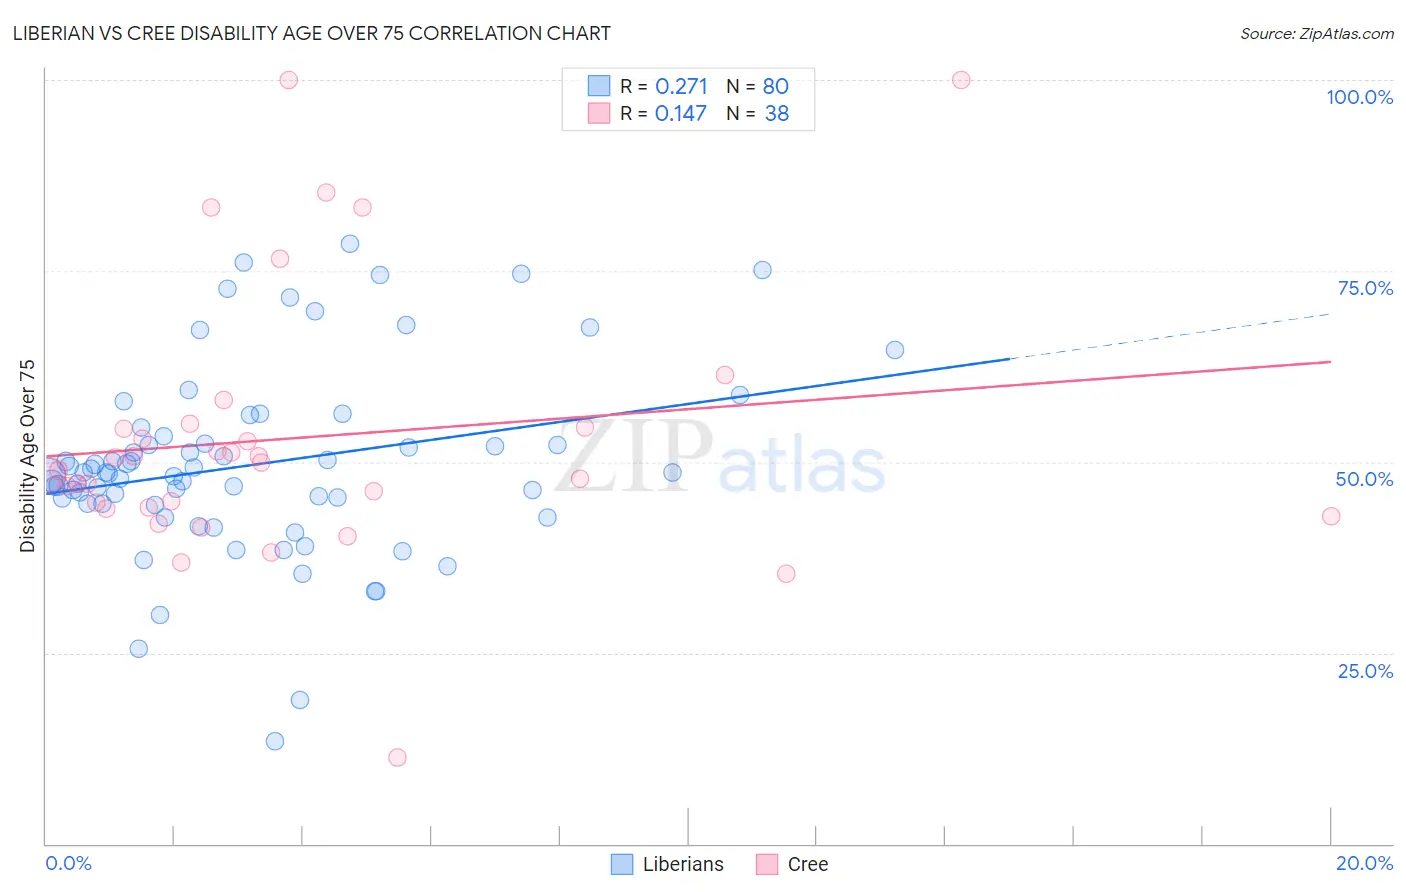
Liberian vs Cree Disability Age Over 75 Correlation Chart
The statistical analysis conducted on geographies consisting of 117,925,448 people shows a weak positive correlation between the proportion of Liberians and percentage of population with a disability over the age of 75 in the United States with a correlation coefficient (R) of 0.271 and weighted average of 48.0%. Similarly, the statistical analysis conducted on geographies consisting of 76,193,108 people shows a poor positive correlation between the proportion of Cree and percentage of population with a disability over the age of 75 in the United States with a correlation coefficient (R) of 0.147 and weighted average of 48.2%, a difference of 0.27%.
Disability Age Over 75 Correlation Summary
| Measurement | Liberian | Cree |
| Minimum | 13.3% | 11.2% |
| Maximum | 78.6% | 100.0% |
| Range | 65.3% | 88.8% |
| Mean | 49.6% | 53.2% |
| Median | 48.5% | 49.4% |
| Interquartile 25% (IQ1) | 44.5% | 44.0% |
| Interquartile 75% (IQ3) | 52.9% | 54.4% |
| Interquartile Range (IQR) | 8.3% | 10.4% |
| Standard Deviation (Sample) | 12.3% | 17.7% |
| Standard Deviation (Population) | 12.2% | 17.5% |
Demographics Similar to Liberians and Cree by Disability Age Over 75
In terms of disability age over 75, the demographic groups most similar to Liberians are Barbadian (48.0%, a difference of 0.010%), Immigrants from Bangladesh (48.0%, a difference of 0.010%), Spanish (48.0%, a difference of 0.010%), Nonimmigrants (48.0%, a difference of 0.020%), and Zimbabwean (48.1%, a difference of 0.020%). Similarly, the demographic groups most similar to Cree are Indonesian (48.2%, a difference of 0.0%), Immigrants (48.2%, a difference of 0.020%), Taiwanese (48.2%, a difference of 0.030%), Subsaharan African (48.2%, a difference of 0.060%), and Hmong (48.2%, a difference of 0.070%).
| Demographics | Rating | Rank | Disability Age Over 75 |
| Immigrants | Western Africa | 8.3 /100 | #218 | Tragic 48.0% |
| Immigrants | Western Asia | 7.5 /100 | #219 | Tragic 48.0% |
| Bahamians | 7.4 /100 | #220 | Tragic 48.0% |
| Immigrants | Oceania | 7.3 /100 | #221 | Tragic 48.0% |
| Barbadians | 6.8 /100 | #222 | Tragic 48.0% |
| Immigrants | Bangladesh | 6.8 /100 | #223 | Tragic 48.0% |
| Liberians | 6.7 /100 | #224 | Tragic 48.0% |
| Spanish | 6.5 /100 | #225 | Tragic 48.0% |
| Immigrants | Nonimmigrants | 6.5 /100 | #226 | Tragic 48.0% |
| Zimbabweans | 6.4 /100 | #227 | Tragic 48.1% |
| Immigrants | Liberia | 5.9 /100 | #228 | Tragic 48.1% |
| Spaniards | 5.7 /100 | #229 | Tragic 48.1% |
| Taiwanese | 4.4 /100 | #230 | Tragic 48.2% |
| Immigrants | Immigrants | 4.3 /100 | #231 | Tragic 48.2% |
| Indonesians | 4.2 /100 | #232 | Tragic 48.2% |
| Cree | 4.2 /100 | #233 | Tragic 48.2% |
| Sub-Saharan Africans | 3.8 /100 | #234 | Tragic 48.2% |
| Hmong | 3.8 /100 | #235 | Tragic 48.2% |
| Immigrants | Nicaragua | 3.2 /100 | #236 | Tragic 48.2% |
| Immigrants | St. Vincent and the Grenadines | 3.2 /100 | #237 | Tragic 48.2% |
| Nicaraguans | 3.0 /100 | #238 | Tragic 48.3% |