Cape Verdean vs Cree Unemployment
COMPARE
Cape Verdean
Cree
Unemployment
Unemployment Comparison
Cape Verdeans
Cree
6.5%
UNEMPLOYMENT
0.0/ 100
METRIC RATING
311th/ 347
METRIC RANK
5.6%
UNEMPLOYMENT
2.6/ 100
METRIC RATING
240th/ 347
METRIC RANK
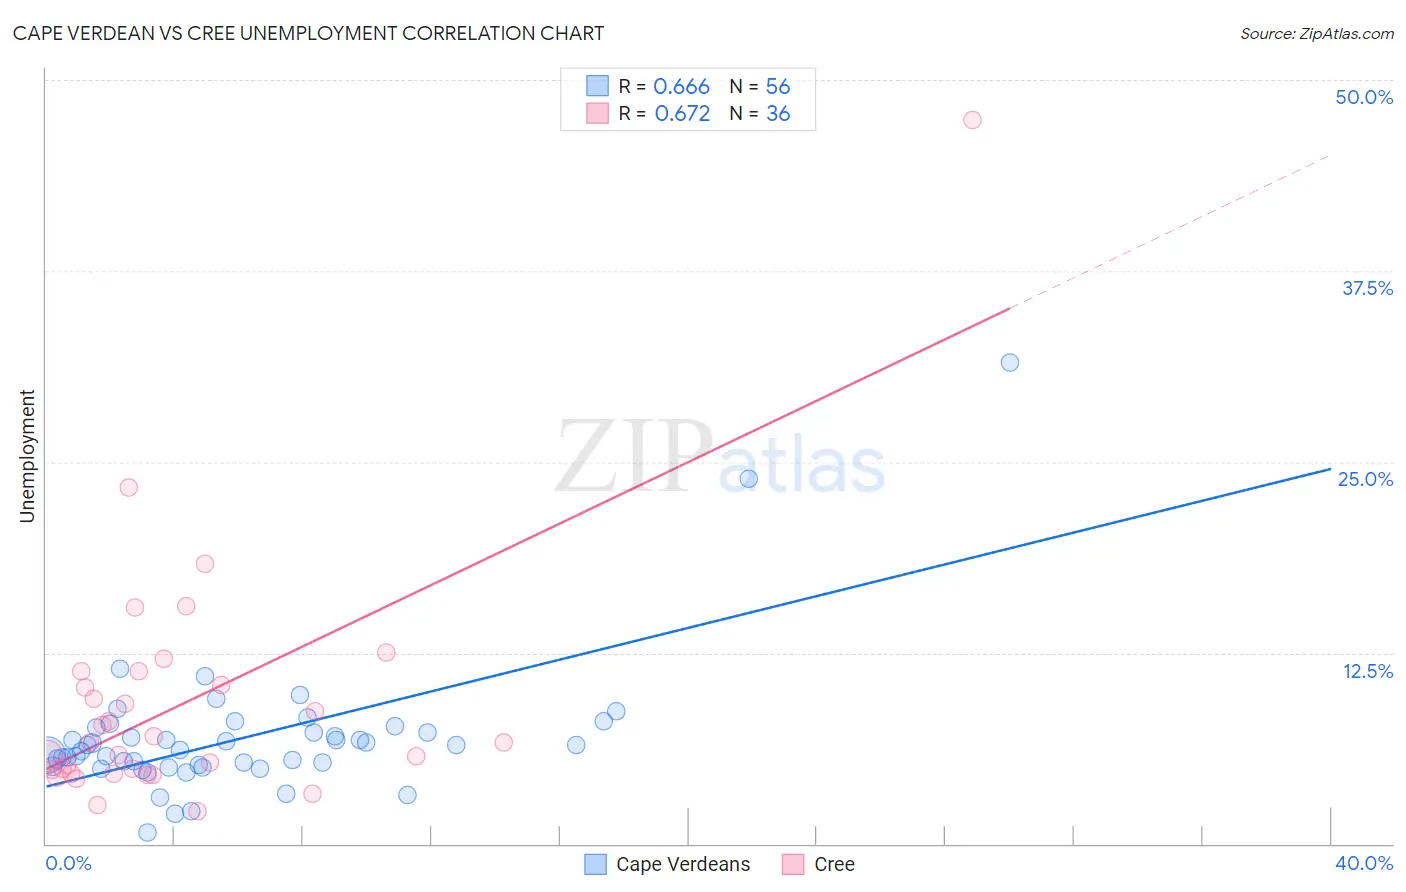
Cape Verdean vs Cree Unemployment Correlation Chart
The statistical analysis conducted on geographies consisting of 107,538,461 people shows a significant positive correlation between the proportion of Cape Verdeans and unemployment in the United States with a correlation coefficient (R) of 0.666 and weighted average of 6.5%. Similarly, the statistical analysis conducted on geographies consisting of 76,166,078 people shows a significant positive correlation between the proportion of Cree and unemployment in the United States with a correlation coefficient (R) of 0.672 and weighted average of 5.6%, a difference of 17.7%.
Unemployment Correlation Summary
| Measurement | Cape Verdean | Cree |
| Minimum | 0.70% | 2.1% |
| Maximum | 31.5% | 47.4% |
| Range | 30.8% | 45.3% |
| Mean | 6.9% | 9.1% |
| Median | 6.3% | 6.6% |
| Interquartile 25% (IQ1) | 5.1% | 4.7% |
| Interquartile 75% (IQ3) | 7.5% | 10.8% |
| Interquartile Range (IQR) | 2.3% | 6.1% |
| Standard Deviation (Sample) | 4.6% | 8.0% |
| Standard Deviation (Population) | 4.5% | 7.9% |
Similar Demographics by Unemployment
Demographics Similar to Cape Verdeans by Unemployment
In terms of unemployment, the demographic groups most similar to Cape Verdeans are Immigrants from Belize (6.5%, a difference of 0.33%), Colville (6.6%, a difference of 0.57%), Vietnamese (6.5%, a difference of 0.60%), Barbadian (6.5%, a difference of 0.61%), and Immigrants from Barbados (6.6%, a difference of 0.95%).
| Demographics | Rating | Rank | Unemployment |
| Immigrants | Jamaica | 0.0 /100 | #304 | Tragic 6.4% |
| Menominee | 0.0 /100 | #305 | Tragic 6.4% |
| Lumbee | 0.0 /100 | #306 | Tragic 6.4% |
| Immigrants | Bangladesh | 0.0 /100 | #307 | Tragic 6.5% |
| Barbadians | 0.0 /100 | #308 | Tragic 6.5% |
| Vietnamese | 0.0 /100 | #309 | Tragic 6.5% |
| Immigrants | Belize | 0.0 /100 | #310 | Tragic 6.5% |
| Cape Verdeans | 0.0 /100 | #311 | Tragic 6.5% |
| Colville | 0.0 /100 | #312 | Tragic 6.6% |
| Immigrants | Barbados | 0.0 /100 | #313 | Tragic 6.6% |
| Blacks/African Americans | 0.0 /100 | #314 | Tragic 6.6% |
| Houma | 0.0 /100 | #315 | Tragic 6.7% |
| Immigrants | Dominica | 0.0 /100 | #316 | Tragic 6.7% |
| Shoshone | 0.0 /100 | #317 | Tragic 6.8% |
| Immigrants | Cabo Verde | 0.0 /100 | #318 | Tragic 6.8% |
Demographics Similar to Cree by Unemployment
In terms of unemployment, the demographic groups most similar to Cree are Immigrants (5.5%, a difference of 0.010%), Immigrants from Western Asia (5.5%, a difference of 0.10%), Moroccan (5.5%, a difference of 0.31%), Tlingit-Haida (5.6%, a difference of 0.34%), and Spanish American (5.6%, a difference of 0.35%).
| Demographics | Rating | Rank | Unemployment |
| Immigrants | Syria | 4.8 /100 | #233 | Tragic 5.5% |
| Panamanians | 4.7 /100 | #234 | Tragic 5.5% |
| Immigrants | Panama | 3.4 /100 | #235 | Tragic 5.5% |
| Immigrants | Cambodia | 3.3 /100 | #236 | Tragic 5.5% |
| Moroccans | 3.2 /100 | #237 | Tragic 5.5% |
| Immigrants | Western Asia | 2.8 /100 | #238 | Tragic 5.5% |
| Immigrants | Immigrants | 2.6 /100 | #239 | Tragic 5.5% |
| Cree | 2.6 /100 | #240 | Tragic 5.6% |
| Tlingit-Haida | 2.0 /100 | #241 | Tragic 5.6% |
| Spanish Americans | 2.0 /100 | #242 | Tragic 5.6% |
| Marshallese | 1.3 /100 | #243 | Tragic 5.6% |
| Dutch West Indians | 1.2 /100 | #244 | Tragic 5.6% |
| French American Indians | 1.2 /100 | #245 | Tragic 5.6% |
| Bermudans | 1.1 /100 | #246 | Tragic 5.6% |
| Immigrants | Cameroon | 1.0 /100 | #247 | Tragic 5.6% |