Immigrants from Czechoslovakia vs Slovene Unemployment Among Women with Children Under 6 years
COMPARE
Immigrants from Czechoslovakia
Slovene
Unemployment Among Women with Children Under 6 years
Unemployment Among Women with Children Under 6 years Comparison
Immigrants from Czechoslovakia
Slovenes
7.0%
UNEMPLOYMENT AMONG WOMEN WITH CHILDREN UNDER 6 YEARS
99.2/ 100
METRIC RATING
73rd/ 347
METRIC RANK
7.4%
UNEMPLOYMENT AMONG WOMEN WITH CHILDREN UNDER 6 YEARS
89.2/ 100
METRIC RATING
129th/ 347
METRIC RANK
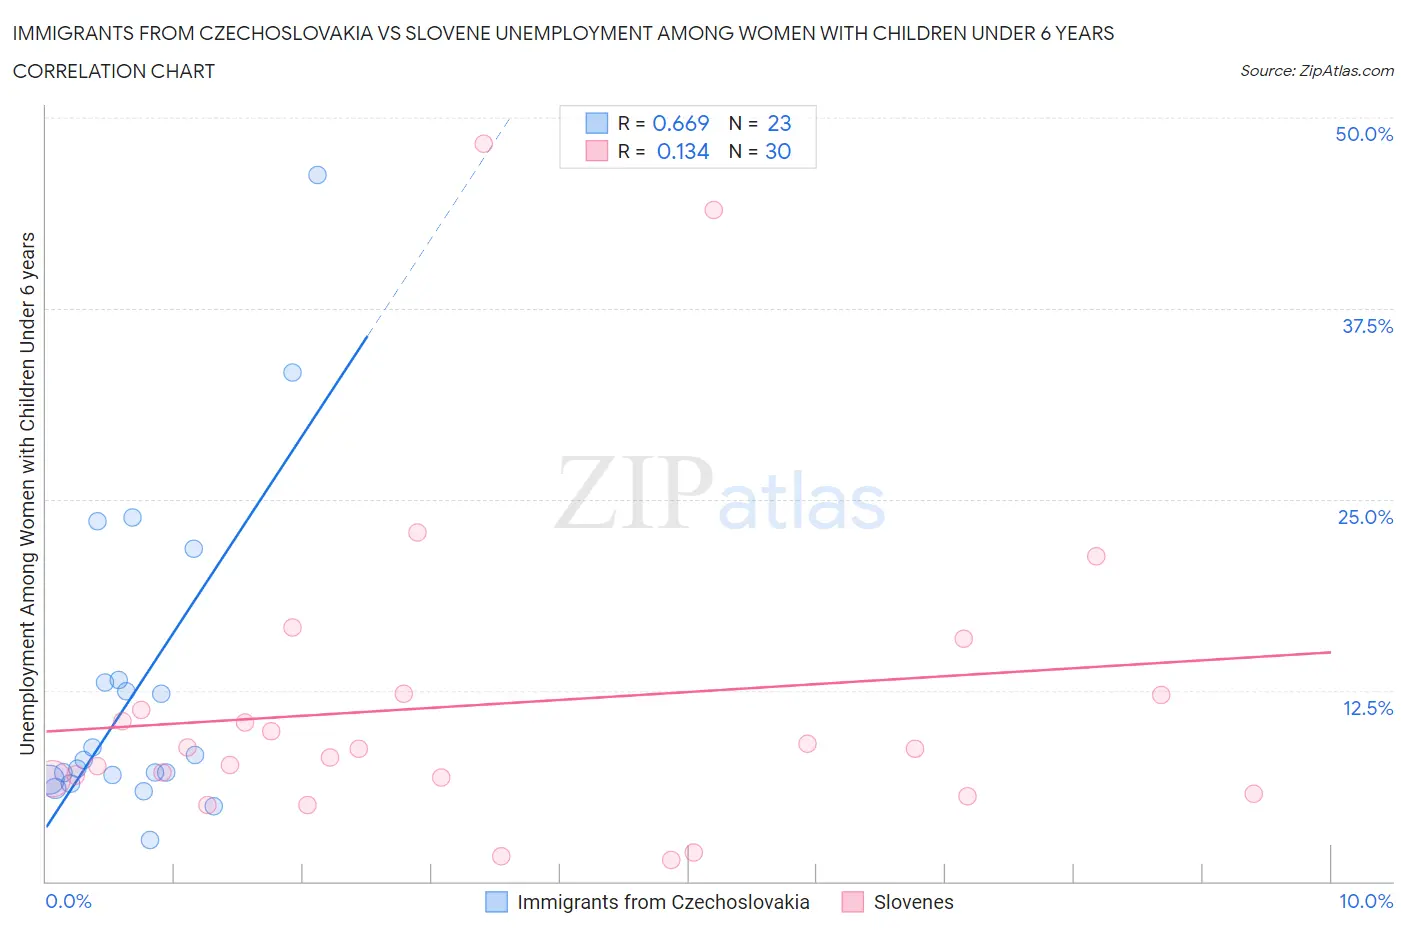
Immigrants from Czechoslovakia vs Slovene Unemployment Among Women with Children Under 6 years Correlation Chart
The statistical analysis conducted on geographies consisting of 163,653,873 people shows a significant positive correlation between the proportion of Immigrants from Czechoslovakia and unemployment rate among women with children under the age of 6 in the United States with a correlation coefficient (R) of 0.669 and weighted average of 7.0%. Similarly, the statistical analysis conducted on geographies consisting of 204,544,718 people shows a poor positive correlation between the proportion of Slovenes and unemployment rate among women with children under the age of 6 in the United States with a correlation coefficient (R) of 0.134 and weighted average of 7.4%, a difference of 4.8%.
Unemployment Among Women with Children Under 6 years Correlation Summary
| Measurement | Immigrants from Czechoslovakia | Slovene |
| Minimum | 2.7% | 1.4% |
| Maximum | 46.2% | 48.3% |
| Range | 43.5% | 46.9% |
| Mean | 12.7% | 11.6% |
| Median | 8.0% | 8.7% |
| Interquartile 25% (IQ1) | 6.6% | 6.7% |
| Interquartile 75% (IQ3) | 13.2% | 12.2% |
| Interquartile Range (IQR) | 6.5% | 5.5% |
| Standard Deviation (Sample) | 10.5% | 10.6% |
| Standard Deviation (Population) | 10.2% | 10.5% |
Similar Demographics by Unemployment Among Women with Children Under 6 years
Demographics Similar to Immigrants from Czechoslovakia by Unemployment Among Women with Children Under 6 years
In terms of unemployment among women with children under 6 years, the demographic groups most similar to Immigrants from Czechoslovakia are Turkish (7.0%, a difference of 0.010%), Immigrants from Eastern Europe (7.1%, a difference of 0.40%), Estonian (7.1%, a difference of 0.45%), Immigrants from Croatia (7.1%, a difference of 0.49%), and Cuban (7.0%, a difference of 0.52%).
| Demographics | Rating | Rank | Unemployment Among Women with Children Under 6 years |
| Immigrants | Belgium | 99.6 /100 | #66 | Exceptional 6.9% |
| Immigrants | Netherlands | 99.5 /100 | #67 | Exceptional 7.0% |
| Paraguayans | 99.4 /100 | #68 | Exceptional 7.0% |
| Immigrants | Eritrea | 99.4 /100 | #69 | Exceptional 7.0% |
| Immigrants | Iraq | 99.4 /100 | #70 | Exceptional 7.0% |
| Afghans | 99.4 /100 | #71 | Exceptional 7.0% |
| Cubans | 99.4 /100 | #72 | Exceptional 7.0% |
| Immigrants | Czechoslovakia | 99.2 /100 | #73 | Exceptional 7.0% |
| Turks | 99.2 /100 | #74 | Exceptional 7.0% |
| Immigrants | Eastern Europe | 99.0 /100 | #75 | Exceptional 7.1% |
| Estonians | 99.0 /100 | #76 | Exceptional 7.1% |
| Immigrants | Croatia | 98.9 /100 | #77 | Exceptional 7.1% |
| Immigrants | Somalia | 98.9 /100 | #78 | Exceptional 7.1% |
| Immigrants | Fiji | 98.9 /100 | #79 | Exceptional 7.1% |
| Immigrants | Greece | 98.9 /100 | #80 | Exceptional 7.1% |
Demographics Similar to Slovenes by Unemployment Among Women with Children Under 6 years
In terms of unemployment among women with children under 6 years, the demographic groups most similar to Slovenes are Swedish (7.4%, a difference of 0.14%), Ukrainian (7.4%, a difference of 0.17%), Immigrants from Armenia (7.4%, a difference of 0.30%), Immigrants from Uganda (7.4%, a difference of 0.43%), and Jordanian (7.3%, a difference of 0.45%).
| Demographics | Rating | Rank | Unemployment Among Women with Children Under 6 years |
| Immigrants | Bosnia and Herzegovina | 93.5 /100 | #122 | Exceptional 7.3% |
| Immigrants | Zaire | 93.3 /100 | #123 | Exceptional 7.3% |
| Immigrants | South Africa | 92.5 /100 | #124 | Exceptional 7.3% |
| Pakistanis | 92.2 /100 | #125 | Exceptional 7.3% |
| Immigrants | Burma/Myanmar | 91.9 /100 | #126 | Exceptional 7.3% |
| Jordanians | 91.5 /100 | #127 | Exceptional 7.3% |
| Zimbabweans | 91.5 /100 | #128 | Exceptional 7.3% |
| Slovenes | 89.2 /100 | #129 | Excellent 7.4% |
| Swedes | 88.4 /100 | #130 | Excellent 7.4% |
| Ukrainians | 88.2 /100 | #131 | Excellent 7.4% |
| Immigrants | Armenia | 87.4 /100 | #132 | Excellent 7.4% |
| Immigrants | Uganda | 86.5 /100 | #133 | Excellent 7.4% |
| Immigrants | Bolivia | 85.7 /100 | #134 | Excellent 7.4% |
| Immigrants | Northern Africa | 85.3 /100 | #135 | Excellent 7.4% |
| Immigrants | Morocco | 84.9 /100 | #136 | Excellent 7.4% |