Aleut vs Slovene Unemployment Among Women with Children Under 6 years
COMPARE
Aleut
Slovene
Unemployment Among Women with Children Under 6 years
Unemployment Among Women with Children Under 6 years Comparison
Aleuts
Slovenes
7.5%
UNEMPLOYMENT AMONG WOMEN WITH CHILDREN UNDER 6 YEARS
76.0/ 100
METRIC RATING
150th/ 347
METRIC RANK
7.4%
UNEMPLOYMENT AMONG WOMEN WITH CHILDREN UNDER 6 YEARS
89.2/ 100
METRIC RATING
129th/ 347
METRIC RANK
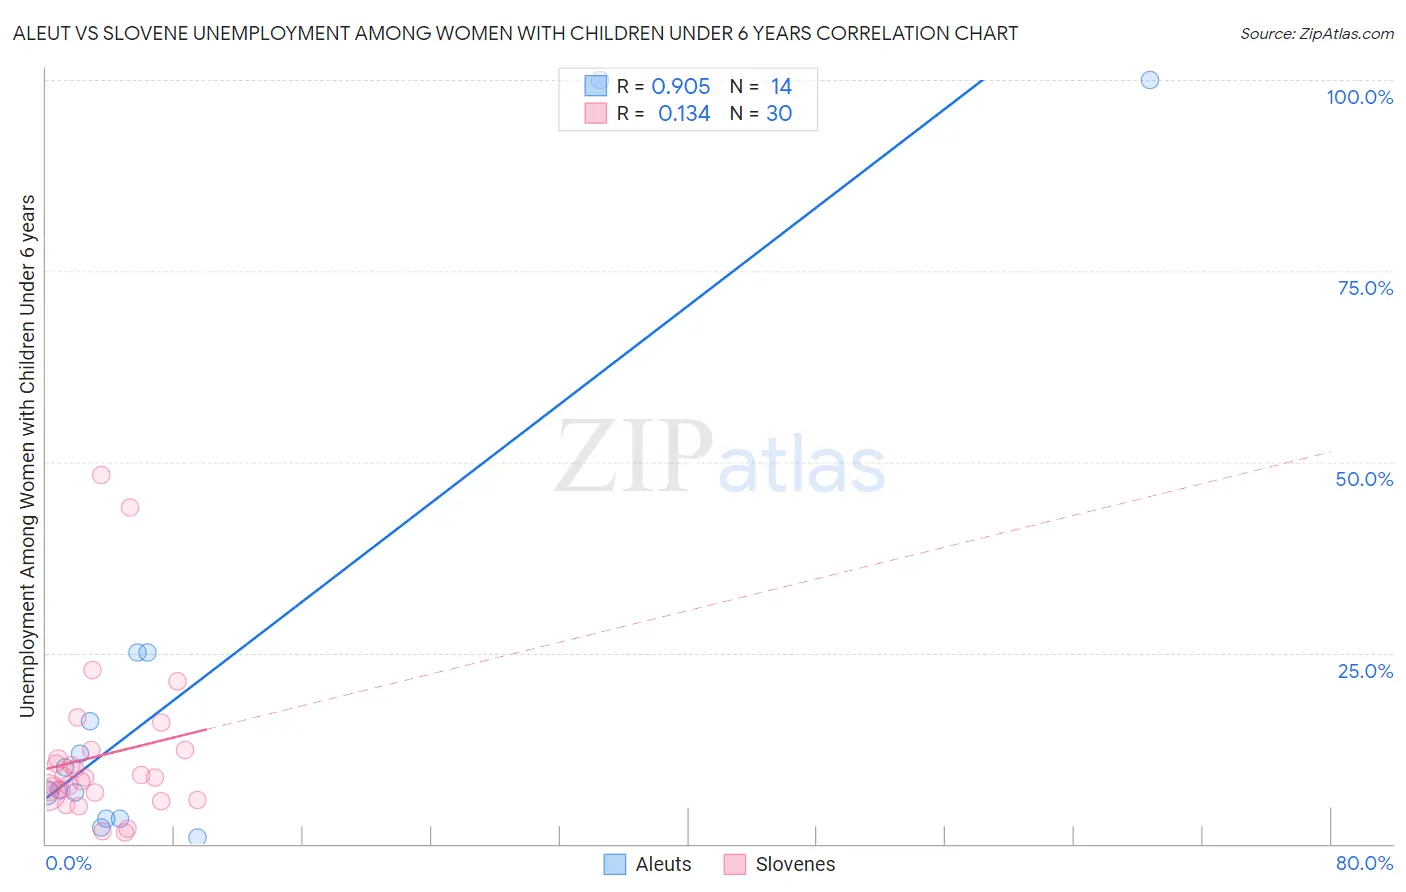
Aleut vs Slovene Unemployment Among Women with Children Under 6 years Correlation Chart
The statistical analysis conducted on geographies consisting of 56,364,668 people shows a near-perfect positive correlation between the proportion of Aleuts and unemployment rate among women with children under the age of 6 in the United States with a correlation coefficient (R) of 0.905 and weighted average of 7.5%. Similarly, the statistical analysis conducted on geographies consisting of 204,544,718 people shows a poor positive correlation between the proportion of Slovenes and unemployment rate among women with children under the age of 6 in the United States with a correlation coefficient (R) of 0.134 and weighted average of 7.4%, a difference of 1.6%.
Unemployment Among Women with Children Under 6 years Correlation Summary
| Measurement | Aleut | Slovene |
| Minimum | 0.80% | 1.4% |
| Maximum | 100.0% | 48.3% |
| Range | 99.2% | 46.9% |
| Mean | 22.7% | 11.6% |
| Median | 8.5% | 8.7% |
| Interquartile 25% (IQ1) | 3.3% | 6.7% |
| Interquartile 75% (IQ3) | 25.0% | 12.2% |
| Interquartile Range (IQR) | 21.7% | 5.5% |
| Standard Deviation (Sample) | 33.6% | 10.6% |
| Standard Deviation (Population) | 32.4% | 10.5% |
Similar Demographics by Unemployment Among Women with Children Under 6 years
Demographics Similar to Aleuts by Unemployment Among Women with Children Under 6 years
In terms of unemployment among women with children under 6 years, the demographic groups most similar to Aleuts are Colombian (7.5%, a difference of 0.010%), Immigrants from Peru (7.5%, a difference of 0.10%), Bangladeshi (7.5%, a difference of 0.11%), Immigrants from Brazil (7.5%, a difference of 0.12%), and Uruguayan (7.5%, a difference of 0.12%).
| Demographics | Rating | Rank | Unemployment Among Women with Children Under 6 years |
| Koreans | 81.3 /100 | #143 | Excellent 7.5% |
| Europeans | 79.1 /100 | #144 | Good 7.5% |
| Immigrants | Jordan | 78.9 /100 | #145 | Good 7.5% |
| Japanese | 78.9 /100 | #146 | Good 7.5% |
| Immigrants | Oceania | 78.4 /100 | #147 | Good 7.5% |
| Immigrants | Brazil | 77.3 /100 | #148 | Good 7.5% |
| Colombians | 76.1 /100 | #149 | Good 7.5% |
| Aleuts | 76.0 /100 | #150 | Good 7.5% |
| Immigrants | Peru | 74.9 /100 | #151 | Good 7.5% |
| Bangladeshis | 74.8 /100 | #152 | Good 7.5% |
| Uruguayans | 74.7 /100 | #153 | Good 7.5% |
| Northern Europeans | 74.3 /100 | #154 | Good 7.5% |
| South Americans | 74.1 /100 | #155 | Good 7.5% |
| Immigrants | Southern Europe | 73.2 /100 | #156 | Good 7.5% |
| Peruvians | 72.3 /100 | #157 | Good 7.5% |
Demographics Similar to Slovenes by Unemployment Among Women with Children Under 6 years
In terms of unemployment among women with children under 6 years, the demographic groups most similar to Slovenes are Swedish (7.4%, a difference of 0.14%), Ukrainian (7.4%, a difference of 0.17%), Immigrants from Armenia (7.4%, a difference of 0.30%), Immigrants from Uganda (7.4%, a difference of 0.43%), and Jordanian (7.3%, a difference of 0.45%).
| Demographics | Rating | Rank | Unemployment Among Women with Children Under 6 years |
| Immigrants | Bosnia and Herzegovina | 93.5 /100 | #122 | Exceptional 7.3% |
| Immigrants | Zaire | 93.3 /100 | #123 | Exceptional 7.3% |
| Immigrants | South Africa | 92.5 /100 | #124 | Exceptional 7.3% |
| Pakistanis | 92.2 /100 | #125 | Exceptional 7.3% |
| Immigrants | Burma/Myanmar | 91.9 /100 | #126 | Exceptional 7.3% |
| Jordanians | 91.5 /100 | #127 | Exceptional 7.3% |
| Zimbabweans | 91.5 /100 | #128 | Exceptional 7.3% |
| Slovenes | 89.2 /100 | #129 | Excellent 7.4% |
| Swedes | 88.4 /100 | #130 | Excellent 7.4% |
| Ukrainians | 88.2 /100 | #131 | Excellent 7.4% |
| Immigrants | Armenia | 87.4 /100 | #132 | Excellent 7.4% |
| Immigrants | Uganda | 86.5 /100 | #133 | Excellent 7.4% |
| Immigrants | Bolivia | 85.7 /100 | #134 | Excellent 7.4% |
| Immigrants | Northern Africa | 85.3 /100 | #135 | Excellent 7.4% |
| Immigrants | Morocco | 84.9 /100 | #136 | Excellent 7.4% |