Guyanese vs Slovene Unemployment Among Women with Children Under 6 years
COMPARE
Guyanese
Slovene
Unemployment Among Women with Children Under 6 years
Unemployment Among Women with Children Under 6 years Comparison
Guyanese
Slovenes
8.2%
UNEMPLOYMENT AMONG WOMEN WITH CHILDREN UNDER 6 YEARS
1.0/ 100
METRIC RATING
251st/ 347
METRIC RANK
7.4%
UNEMPLOYMENT AMONG WOMEN WITH CHILDREN UNDER 6 YEARS
89.2/ 100
METRIC RATING
129th/ 347
METRIC RANK
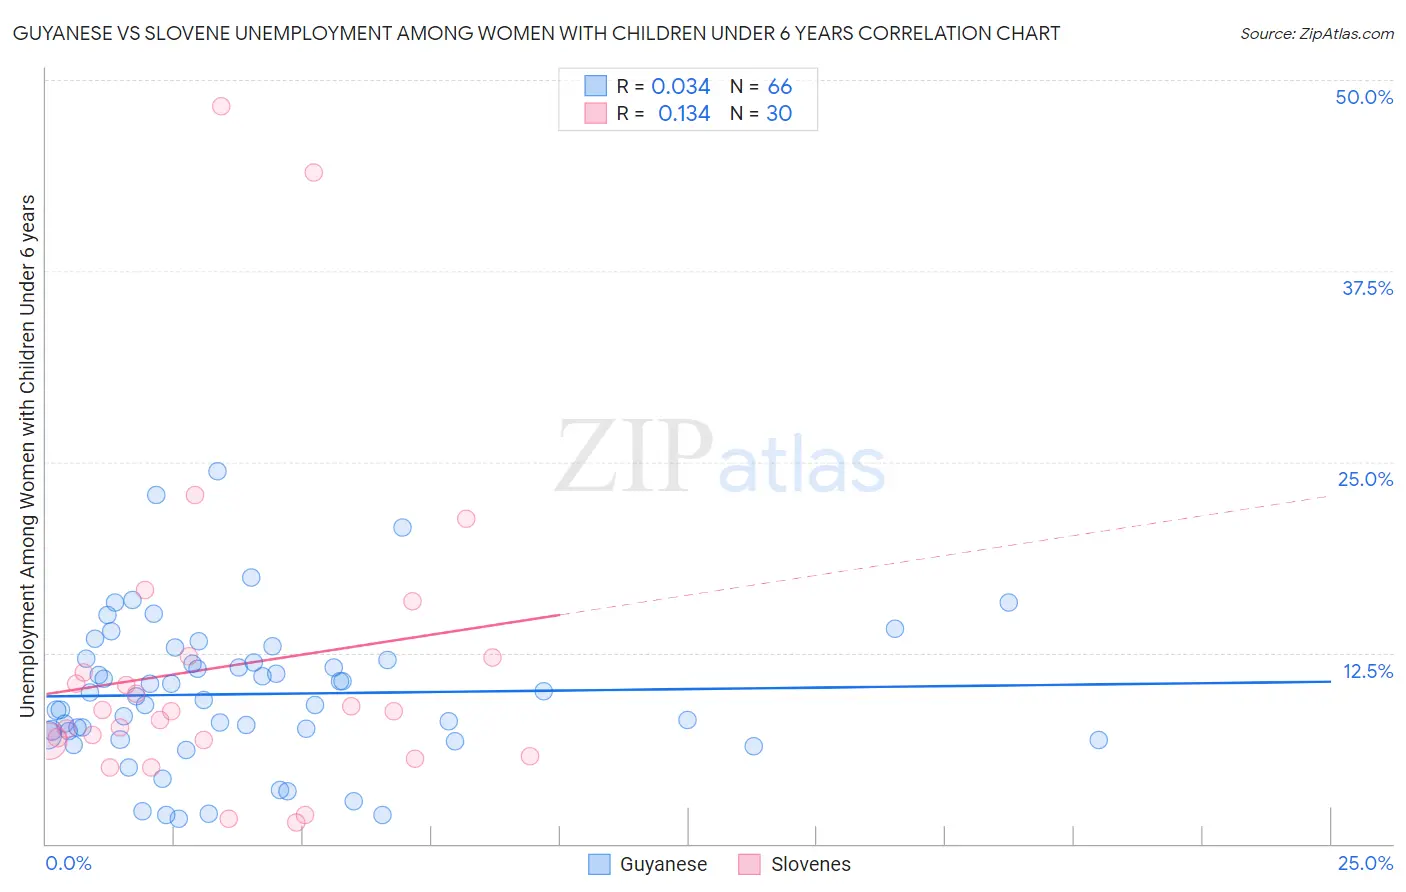
Guyanese vs Slovene Unemployment Among Women with Children Under 6 years Correlation Chart
The statistical analysis conducted on geographies consisting of 150,761,522 people shows no correlation between the proportion of Guyanese and unemployment rate among women with children under the age of 6 in the United States with a correlation coefficient (R) of 0.034 and weighted average of 8.2%. Similarly, the statistical analysis conducted on geographies consisting of 204,544,718 people shows a poor positive correlation between the proportion of Slovenes and unemployment rate among women with children under the age of 6 in the United States with a correlation coefficient (R) of 0.134 and weighted average of 7.4%, a difference of 11.6%.
Unemployment Among Women with Children Under 6 years Correlation Summary
| Measurement | Guyanese | Slovene |
| Minimum | 1.6% | 1.4% |
| Maximum | 24.4% | 48.3% |
| Range | 22.8% | 46.9% |
| Mean | 9.8% | 11.6% |
| Median | 9.5% | 8.7% |
| Interquartile 25% (IQ1) | 7.1% | 6.7% |
| Interquartile 75% (IQ3) | 12.0% | 12.2% |
| Interquartile Range (IQR) | 4.9% | 5.5% |
| Standard Deviation (Sample) | 4.7% | 10.6% |
| Standard Deviation (Population) | 4.7% | 10.5% |
Similar Demographics by Unemployment Among Women with Children Under 6 years
Demographics Similar to Guyanese by Unemployment Among Women with Children Under 6 years
In terms of unemployment among women with children under 6 years, the demographic groups most similar to Guyanese are Ghanaian (8.2%, a difference of 0.0%), Nigerian (8.2%, a difference of 0.17%), Immigrants from Sierra Leone (8.2%, a difference of 0.18%), Immigrants from Guyana (8.2%, a difference of 0.18%), and Immigrants from Western Africa (8.2%, a difference of 0.27%).
| Demographics | Rating | Rank | Unemployment Among Women with Children Under 6 years |
| French | 1.7 /100 | #244 | Tragic 8.2% |
| Native Hawaiians | 1.7 /100 | #245 | Tragic 8.2% |
| Central Americans | 1.4 /100 | #246 | Tragic 8.2% |
| German Russians | 1.2 /100 | #247 | Tragic 8.2% |
| Immigrants | Western Africa | 1.1 /100 | #248 | Tragic 8.2% |
| Immigrants | Sierra Leone | 1.1 /100 | #249 | Tragic 8.2% |
| Nigerians | 1.1 /100 | #250 | Tragic 8.2% |
| Guyanese | 1.0 /100 | #251 | Tragic 8.2% |
| Ghanaians | 1.0 /100 | #252 | Tragic 8.2% |
| Immigrants | Guyana | 0.8 /100 | #253 | Tragic 8.2% |
| Immigrants | Caribbean | 0.7 /100 | #254 | Tragic 8.3% |
| Immigrants | Portugal | 0.6 /100 | #255 | Tragic 8.3% |
| Celtics | 0.6 /100 | #256 | Tragic 8.3% |
| British West Indians | 0.5 /100 | #257 | Tragic 8.3% |
| Immigrants | Ghana | 0.5 /100 | #258 | Tragic 8.3% |
Demographics Similar to Slovenes by Unemployment Among Women with Children Under 6 years
In terms of unemployment among women with children under 6 years, the demographic groups most similar to Slovenes are Swedish (7.4%, a difference of 0.14%), Ukrainian (7.4%, a difference of 0.17%), Immigrants from Armenia (7.4%, a difference of 0.30%), Immigrants from Uganda (7.4%, a difference of 0.43%), and Jordanian (7.3%, a difference of 0.45%).
| Demographics | Rating | Rank | Unemployment Among Women with Children Under 6 years |
| Immigrants | Bosnia and Herzegovina | 93.5 /100 | #122 | Exceptional 7.3% |
| Immigrants | Zaire | 93.3 /100 | #123 | Exceptional 7.3% |
| Immigrants | South Africa | 92.5 /100 | #124 | Exceptional 7.3% |
| Pakistanis | 92.2 /100 | #125 | Exceptional 7.3% |
| Immigrants | Burma/Myanmar | 91.9 /100 | #126 | Exceptional 7.3% |
| Jordanians | 91.5 /100 | #127 | Exceptional 7.3% |
| Zimbabweans | 91.5 /100 | #128 | Exceptional 7.3% |
| Slovenes | 89.2 /100 | #129 | Excellent 7.4% |
| Swedes | 88.4 /100 | #130 | Excellent 7.4% |
| Ukrainians | 88.2 /100 | #131 | Excellent 7.4% |
| Immigrants | Armenia | 87.4 /100 | #132 | Excellent 7.4% |
| Immigrants | Uganda | 86.5 /100 | #133 | Excellent 7.4% |
| Immigrants | Bolivia | 85.7 /100 | #134 | Excellent 7.4% |
| Immigrants | Northern Africa | 85.3 /100 | #135 | Excellent 7.4% |
| Immigrants | Morocco | 84.9 /100 | #136 | Excellent 7.4% |