Iranian vs Immigrants from Africa Female Unemployment
COMPARE
Iranian
Immigrants from Africa
Female Unemployment
Female Unemployment Comparison
Iranians
Immigrants from Africa
5.3%
FEMALE UNEMPLOYMENT
50.4/ 100
METRIC RATING
173rd/ 347
METRIC RANK
5.4%
FEMALE UNEMPLOYMENT
8.5/ 100
METRIC RATING
220th/ 347
METRIC RANK
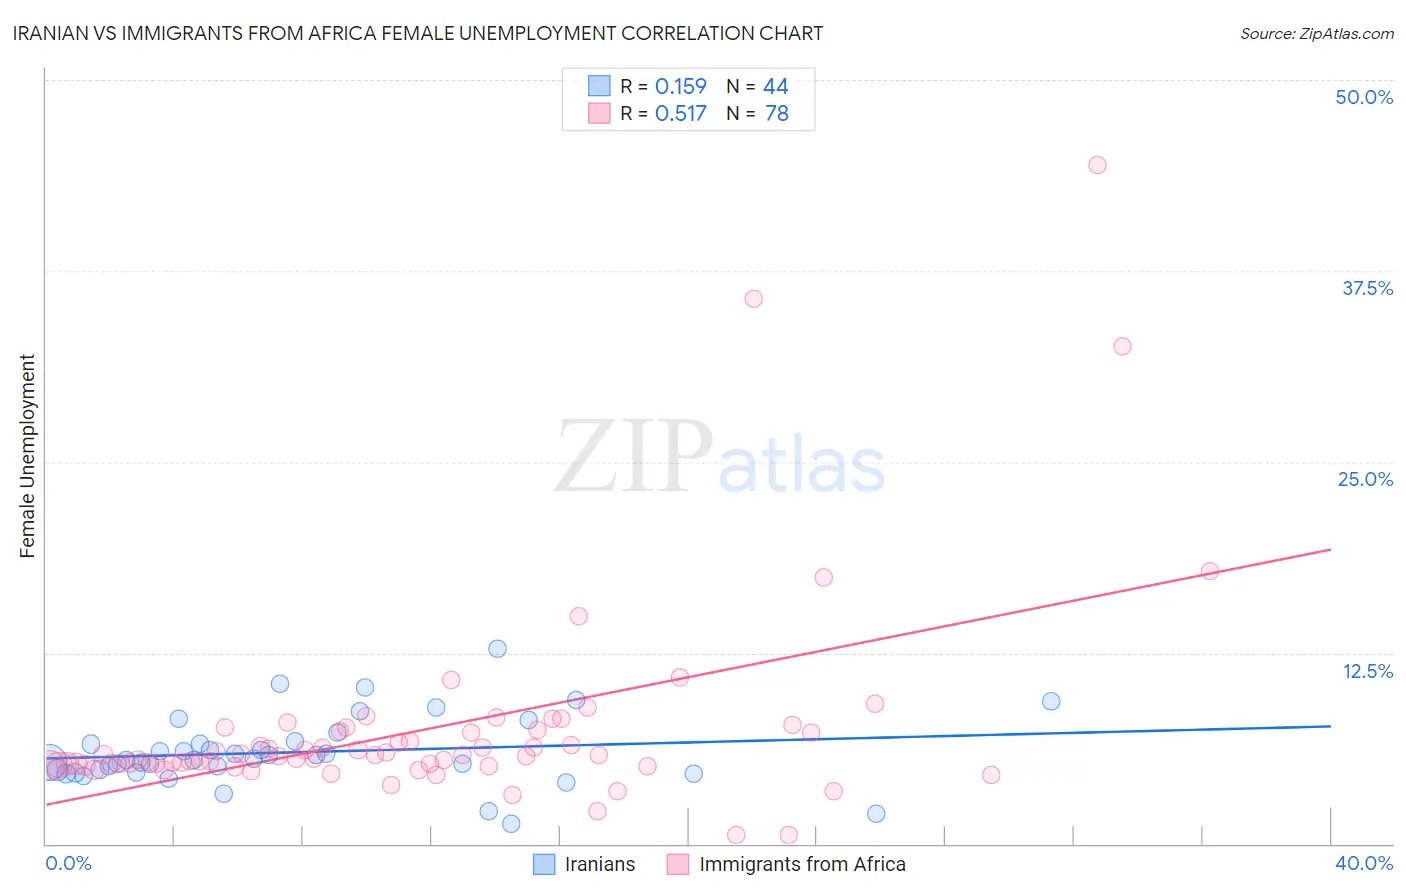
Iranian vs Immigrants from Africa Female Unemployment Correlation Chart
The statistical analysis conducted on geographies consisting of 316,106,096 people shows a poor positive correlation between the proportion of Iranians and unemploymnet rate among females in the United States with a correlation coefficient (R) of 0.159 and weighted average of 5.3%. Similarly, the statistical analysis conducted on geographies consisting of 466,538,458 people shows a substantial positive correlation between the proportion of Immigrants from Africa and unemploymnet rate among females in the United States with a correlation coefficient (R) of 0.517 and weighted average of 5.4%, a difference of 3.6%.
Female Unemployment Correlation Summary
| Measurement | Iranian | Immigrants from Africa |
| Minimum | 1.3% | 0.60% |
| Maximum | 12.8% | 44.4% |
| Range | 11.5% | 43.8% |
| Mean | 6.0% | 7.5% |
| Median | 5.6% | 5.8% |
| Interquartile 25% (IQ1) | 4.7% | 5.2% |
| Interquartile 75% (IQ3) | 6.6% | 7.4% |
| Interquartile Range (IQR) | 1.9% | 2.2% |
| Standard Deviation (Sample) | 2.3% | 6.7% |
| Standard Deviation (Population) | 2.2% | 6.7% |
Similar Demographics by Female Unemployment
Demographics Similar to Iranians by Female Unemployment
In terms of female unemployment, the demographic groups most similar to Iranians are Immigrants from Uganda (5.3%, a difference of 0.020%), Immigrants from Poland (5.3%, a difference of 0.020%), Immigrants from Laos (5.3%, a difference of 0.17%), Immigrants from Vietnam (5.3%, a difference of 0.18%), and Immigrants from Morocco (5.3%, a difference of 0.18%).
| Demographics | Rating | Rank | Female Unemployment |
| Native Hawaiians | 62.7 /100 | #166 | Good 5.2% |
| Immigrants | Thailand | 62.1 /100 | #167 | Good 5.2% |
| Sri Lankans | 59.4 /100 | #168 | Average 5.2% |
| Immigrants | Chile | 59.0 /100 | #169 | Average 5.2% |
| Spanish | 55.9 /100 | #170 | Average 5.2% |
| Immigrants | Denmark | 55.0 /100 | #171 | Average 5.2% |
| Immigrants | Uganda | 50.7 /100 | #172 | Average 5.3% |
| Iranians | 50.4 /100 | #173 | Average 5.3% |
| Immigrants | Poland | 50.0 /100 | #174 | Average 5.3% |
| Immigrants | Laos | 47.5 /100 | #175 | Average 5.3% |
| Immigrants | Vietnam | 47.5 /100 | #176 | Average 5.3% |
| Immigrants | Morocco | 47.4 /100 | #177 | Average 5.3% |
| Immigrants | Southern Europe | 46.2 /100 | #178 | Average 5.3% |
| Laotians | 45.1 /100 | #179 | Average 5.3% |
| Immigrants | Congo | 43.1 /100 | #180 | Average 5.3% |
Demographics Similar to Immigrants from Africa by Female Unemployment
In terms of female unemployment, the demographic groups most similar to Immigrants from Africa are South American (5.4%, a difference of 0.010%), Bermudan (5.4%, a difference of 0.090%), Peruvian (5.4%, a difference of 0.18%), Brazilian (5.5%, a difference of 0.25%), and Comanche (5.4%, a difference of 0.26%).
| Demographics | Rating | Rank | Female Unemployment |
| Samoans | 10.6 /100 | #213 | Poor 5.4% |
| Seminole | 10.3 /100 | #214 | Poor 5.4% |
| Immigrants | Nicaragua | 10.2 /100 | #215 | Poor 5.4% |
| Comanche | 10.0 /100 | #216 | Poor 5.4% |
| Peruvians | 9.6 /100 | #217 | Tragic 5.4% |
| Bermudans | 9.0 /100 | #218 | Tragic 5.4% |
| South Americans | 8.6 /100 | #219 | Tragic 5.4% |
| Immigrants | Africa | 8.5 /100 | #220 | Tragic 5.4% |
| Brazilians | 7.3 /100 | #221 | Tragic 5.5% |
| Nicaraguans | 7.2 /100 | #222 | Tragic 5.5% |
| Delaware | 7.2 /100 | #223 | Tragic 5.5% |
| Iraqis | 7.1 /100 | #224 | Tragic 5.5% |
| French American Indians | 6.1 /100 | #225 | Tragic 5.5% |
| Immigrants | Peru | 5.9 /100 | #226 | Tragic 5.5% |
| Immigrants | Philippines | 5.3 /100 | #227 | Tragic 5.5% |