Iranian vs Immigrants from Mexico 8th Grade
COMPARE
Iranian
Immigrants from Mexico
8th Grade
8th Grade Comparison
Iranians
Immigrants from Mexico
96.6%
8TH GRADE
99.7/ 100
METRIC RATING
67th/ 347
METRIC RANK
90.2%
8TH GRADE
0.0/ 100
METRIC RATING
346th/ 347
METRIC RANK
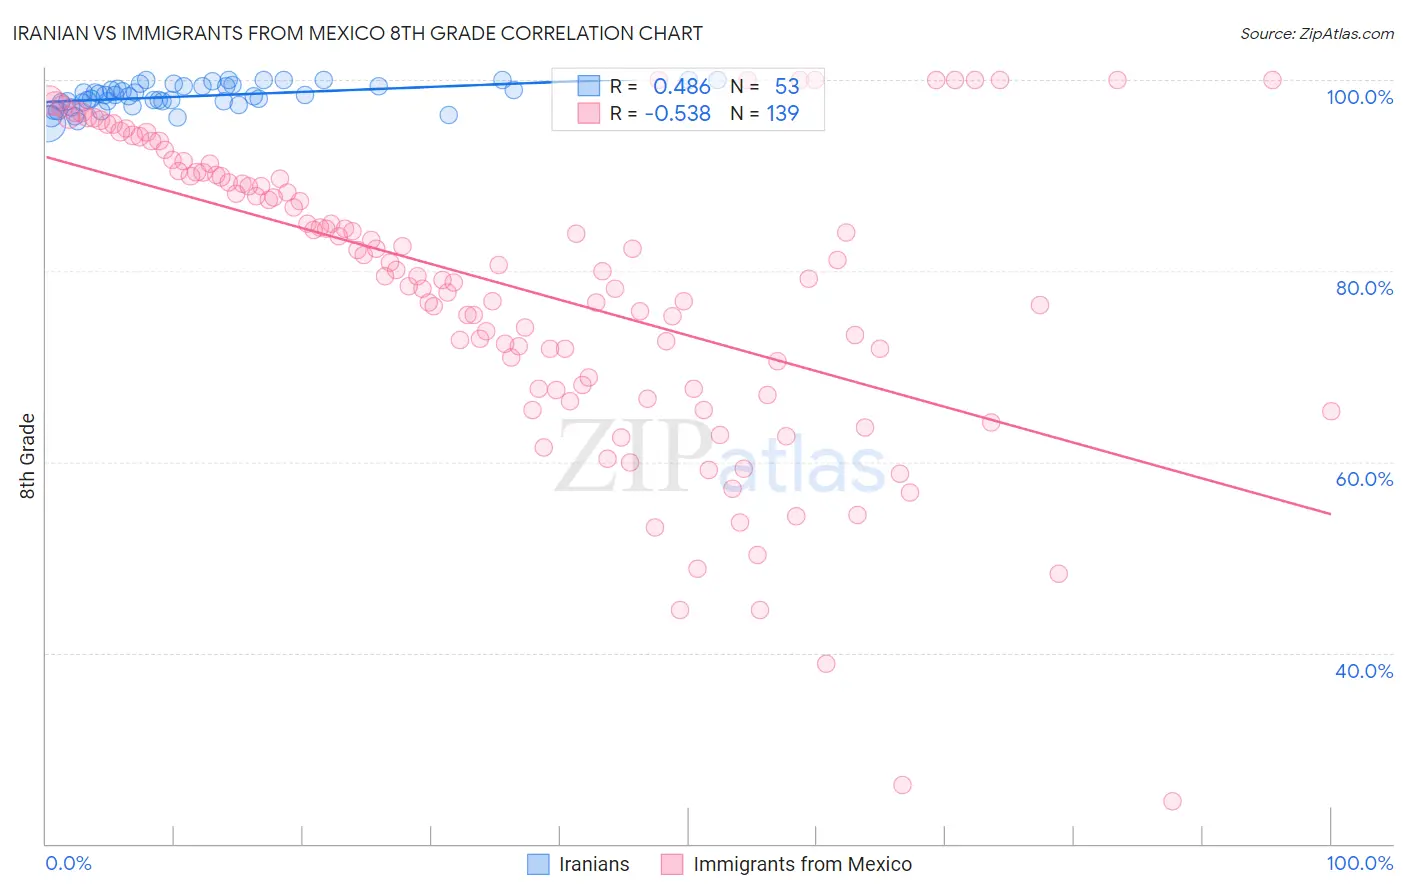
Iranian vs Immigrants from Mexico 8th Grade Correlation Chart
The statistical analysis conducted on geographies consisting of 310,636,461 people shows a moderate positive correlation between the proportion of Iranians and percentage of population with at least 8th grade education in the United States with a correlation coefficient (R) of 0.486 and weighted average of 96.6%. Similarly, the statistical analysis conducted on geographies consisting of 513,767,012 people shows a substantial negative correlation between the proportion of Immigrants from Mexico and percentage of population with at least 8th grade education in the United States with a correlation coefficient (R) of -0.538 and weighted average of 90.2%, a difference of 7.2%.
8th Grade Correlation Summary
| Measurement | Iranian | Immigrants from Mexico |
| Minimum | 95.4% | 24.5% |
| Maximum | 100.0% | 100.0% |
| Range | 4.6% | 75.5% |
| Mean | 98.3% | 78.4% |
| Median | 98.4% | 80.1% |
| Interquartile 25% (IQ1) | 97.7% | 68.0% |
| Interquartile 75% (IQ3) | 99.4% | 90.3% |
| Interquartile Range (IQR) | 1.7% | 22.3% |
| Standard Deviation (Sample) | 1.3% | 15.7% |
| Standard Deviation (Population) | 1.2% | 15.6% |
Similar Demographics by 8th Grade
Demographics Similar to Iranians by 8th Grade
In terms of 8th grade, the demographic groups most similar to Iranians are Ukrainian (96.7%, a difference of 0.010%), Immigrants from India (96.6%, a difference of 0.010%), Native Hawaiian (96.6%, a difference of 0.010%), Canadian (96.6%, a difference of 0.010%), and Creek (96.6%, a difference of 0.010%).
| Demographics | Rating | Rank | 8th Grade |
| Immigrants | Northern Europe | 99.8 /100 | #60 | Exceptional 96.7% |
| Immigrants | Austria | 99.8 /100 | #61 | Exceptional 96.7% |
| Whites/Caucasians | 99.8 /100 | #62 | Exceptional 96.7% |
| Ukrainians | 99.7 /100 | #63 | Exceptional 96.7% |
| Immigrants | India | 99.7 /100 | #64 | Exceptional 96.6% |
| Native Hawaiians | 99.7 /100 | #65 | Exceptional 96.6% |
| Canadians | 99.7 /100 | #66 | Exceptional 96.6% |
| Iranians | 99.7 /100 | #67 | Exceptional 96.6% |
| Creek | 99.7 /100 | #68 | Exceptional 96.6% |
| Americans | 99.7 /100 | #69 | Exceptional 96.6% |
| Immigrants | Lithuania | 99.6 /100 | #70 | Exceptional 96.6% |
| New Zealanders | 99.5 /100 | #71 | Exceptional 96.6% |
| Immigrants | England | 99.5 /100 | #72 | Exceptional 96.6% |
| Arapaho | 99.5 /100 | #73 | Exceptional 96.6% |
| Immigrants | Ireland | 99.5 /100 | #74 | Exceptional 96.5% |
Demographics Similar to Immigrants from Mexico by 8th Grade
In terms of 8th grade, the demographic groups most similar to Immigrants from Mexico are Immigrants from El Salvador (90.3%, a difference of 0.18%), Immigrants from Central America (90.4%, a difference of 0.27%), Spanish American Indian (89.8%, a difference of 0.44%), Immigrants from Guatemala (90.7%, a difference of 0.64%), and Salvadoran (90.9%, a difference of 0.81%).
| Demographics | Rating | Rank | 8th Grade |
| Hispanics or Latinos | 0.0 /100 | #333 | Tragic 92.2% |
| Immigrants | Yemen | 0.0 /100 | #334 | Tragic 92.1% |
| Mexican American Indians | 0.0 /100 | #335 | Tragic 92.1% |
| Immigrants | Honduras | 0.0 /100 | #336 | Tragic 91.9% |
| Immigrants | Latin America | 0.0 /100 | #337 | Tragic 91.7% |
| Central Americans | 0.0 /100 | #338 | Tragic 91.6% |
| Mexicans | 0.0 /100 | #339 | Tragic 91.4% |
| Yakama | 0.0 /100 | #340 | Tragic 91.2% |
| Guatemalans | 0.0 /100 | #341 | Tragic 91.1% |
| Salvadorans | 0.0 /100 | #342 | Tragic 90.9% |
| Immigrants | Guatemala | 0.0 /100 | #343 | Tragic 90.7% |
| Immigrants | Central America | 0.0 /100 | #344 | Tragic 90.4% |
| Immigrants | El Salvador | 0.0 /100 | #345 | Tragic 90.3% |
| Immigrants | Mexico | 0.0 /100 | #346 | Tragic 90.2% |
| Spanish American Indians | 0.0 /100 | #347 | Tragic 89.8% |