Iranian vs Paiute Female Unemployment
COMPARE
Iranian
Paiute
Female Unemployment
Female Unemployment Comparison
Iranians
Paiute
5.3%
FEMALE UNEMPLOYMENT
50.4/ 100
METRIC RATING
173rd/ 347
METRIC RANK
6.8%
FEMALE UNEMPLOYMENT
0.0/ 100
METRIC RATING
331st/ 347
METRIC RANK
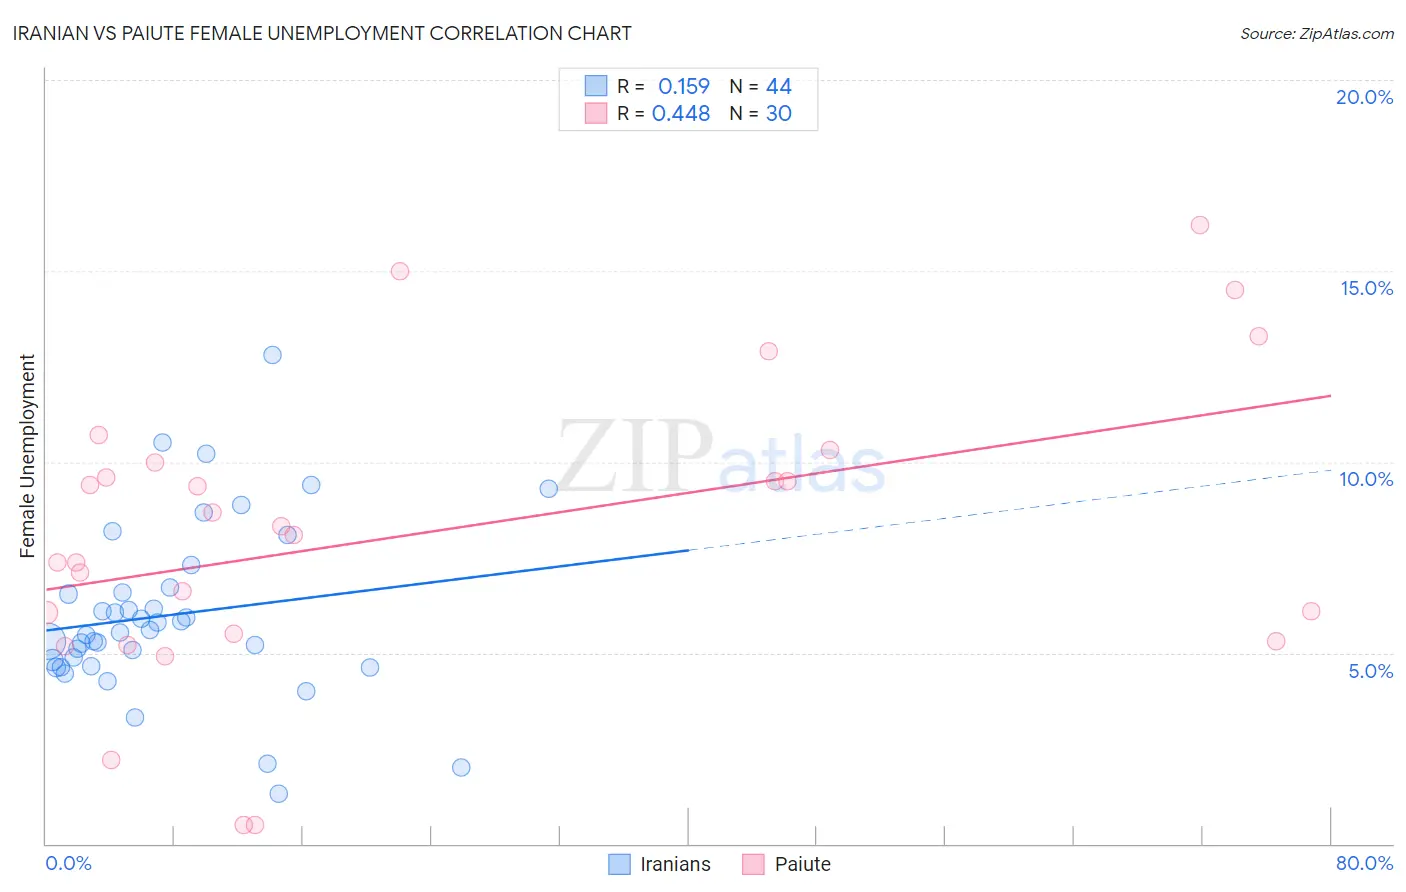
Iranian vs Paiute Female Unemployment Correlation Chart
The statistical analysis conducted on geographies consisting of 316,106,096 people shows a poor positive correlation between the proportion of Iranians and unemploymnet rate among females in the United States with a correlation coefficient (R) of 0.159 and weighted average of 5.3%. Similarly, the statistical analysis conducted on geographies consisting of 58,292,378 people shows a moderate positive correlation between the proportion of Paiute and unemploymnet rate among females in the United States with a correlation coefficient (R) of 0.448 and weighted average of 6.8%, a difference of 29.3%.
Female Unemployment Correlation Summary
| Measurement | Iranian | Paiute |
| Minimum | 1.3% | 0.50% |
| Maximum | 12.8% | 16.2% |
| Range | 11.5% | 15.7% |
| Mean | 6.0% | 8.2% |
| Median | 5.6% | 8.2% |
| Interquartile 25% (IQ1) | 4.7% | 5.5% |
| Interquartile 75% (IQ3) | 6.6% | 10.0% |
| Interquartile Range (IQR) | 1.9% | 4.5% |
| Standard Deviation (Sample) | 2.3% | 3.9% |
| Standard Deviation (Population) | 2.2% | 3.8% |
Similar Demographics by Female Unemployment
Demographics Similar to Iranians by Female Unemployment
In terms of female unemployment, the demographic groups most similar to Iranians are Immigrants from Uganda (5.3%, a difference of 0.020%), Immigrants from Poland (5.3%, a difference of 0.020%), Immigrants from Laos (5.3%, a difference of 0.17%), Immigrants from Vietnam (5.3%, a difference of 0.18%), and Immigrants from Morocco (5.3%, a difference of 0.18%).
| Demographics | Rating | Rank | Female Unemployment |
| Native Hawaiians | 62.7 /100 | #166 | Good 5.2% |
| Immigrants | Thailand | 62.1 /100 | #167 | Good 5.2% |
| Sri Lankans | 59.4 /100 | #168 | Average 5.2% |
| Immigrants | Chile | 59.0 /100 | #169 | Average 5.2% |
| Spanish | 55.9 /100 | #170 | Average 5.2% |
| Immigrants | Denmark | 55.0 /100 | #171 | Average 5.2% |
| Immigrants | Uganda | 50.7 /100 | #172 | Average 5.3% |
| Iranians | 50.4 /100 | #173 | Average 5.3% |
| Immigrants | Poland | 50.0 /100 | #174 | Average 5.3% |
| Immigrants | Laos | 47.5 /100 | #175 | Average 5.3% |
| Immigrants | Vietnam | 47.5 /100 | #176 | Average 5.3% |
| Immigrants | Morocco | 47.4 /100 | #177 | Average 5.3% |
| Immigrants | Southern Europe | 46.2 /100 | #178 | Average 5.3% |
| Laotians | 45.1 /100 | #179 | Average 5.3% |
| Immigrants | Congo | 43.1 /100 | #180 | Average 5.3% |
Demographics Similar to Paiute by Female Unemployment
In terms of female unemployment, the demographic groups most similar to Paiute are Yakama (6.7%, a difference of 1.1%), Immigrants from Guyana (6.7%, a difference of 1.7%), Guyanese (6.7%, a difference of 2.1%), Alaska Native (6.6%, a difference of 2.5%), and Native/Alaskan (6.6%, a difference of 2.6%).
| Demographics | Rating | Rank | Female Unemployment |
| Cheyenne | 0.0 /100 | #324 | Tragic 6.6% |
| Apache | 0.0 /100 | #325 | Tragic 6.6% |
| Natives/Alaskans | 0.0 /100 | #326 | Tragic 6.6% |
| Alaska Natives | 0.0 /100 | #327 | Tragic 6.6% |
| Guyanese | 0.0 /100 | #328 | Tragic 6.7% |
| Immigrants | Guyana | 0.0 /100 | #329 | Tragic 6.7% |
| Yakama | 0.0 /100 | #330 | Tragic 6.7% |
| Paiute | 0.0 /100 | #331 | Tragic 6.8% |
| Sioux | 0.0 /100 | #332 | Tragic 7.0% |
| Menominee | 0.0 /100 | #333 | Tragic 7.0% |
| Immigrants | Armenia | 0.0 /100 | #334 | Tragic 7.1% |
| Dominicans | 0.0 /100 | #335 | Tragic 7.2% |
| Immigrants | Dominican Republic | 0.0 /100 | #336 | Tragic 7.2% |
| Navajo | 0.0 /100 | #337 | Tragic 7.3% |
| Tohono O'odham | 0.0 /100 | #338 | Tragic 7.7% |