Immigrants from St. Vincent and the Grenadines vs White/Caucasian Unemployment
COMPARE
Immigrants from St. Vincent and the Grenadines
White/Caucasian
Unemployment
Unemployment Comparison
Immigrants from St. Vincent and the Grenadines
Whites/Caucasians
6.9%
UNEMPLOYMENT
0.0/ 100
METRIC RATING
320th/ 347
METRIC RANK
4.9%
UNEMPLOYMENT
99.2/ 100
METRIC RATING
52nd/ 347
METRIC RANK
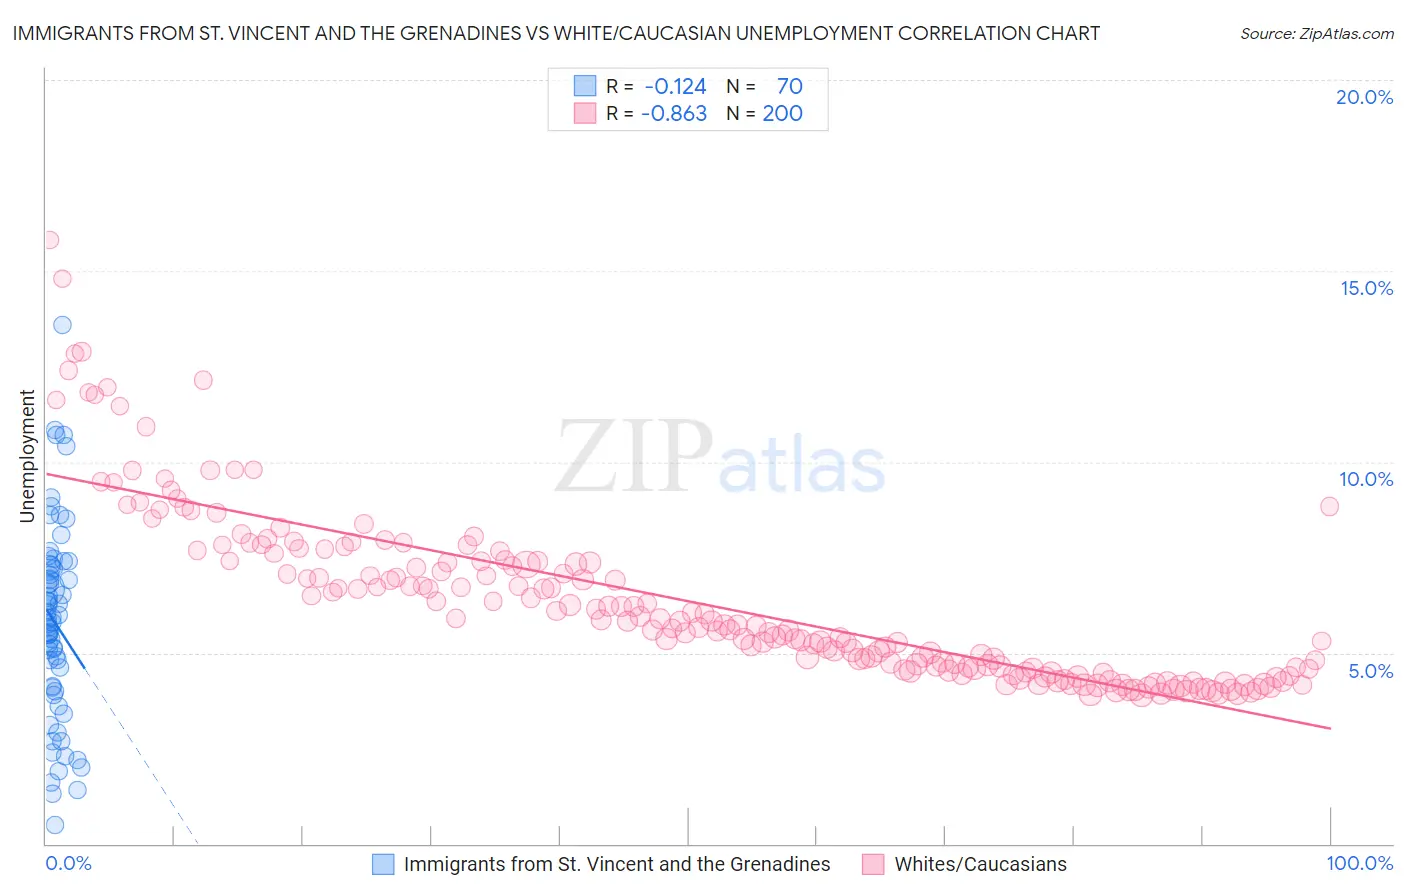
Immigrants from St. Vincent and the Grenadines vs White/Caucasian Unemployment Correlation Chart
The statistical analysis conducted on geographies consisting of 56,184,646 people shows a poor negative correlation between the proportion of Immigrants from St. Vincent and the Grenadines and unemployment in the United States with a correlation coefficient (R) of -0.124 and weighted average of 6.9%. Similarly, the statistical analysis conducted on geographies consisting of 578,869,025 people shows a very strong negative correlation between the proportion of Whites/Caucasians and unemployment in the United States with a correlation coefficient (R) of -0.863 and weighted average of 4.9%, a difference of 41.6%.
Unemployment Correlation Summary
| Measurement | Immigrants from St. Vincent and the Grenadines | White/Caucasian |
| Minimum | 0.50% | 3.9% |
| Maximum | 13.6% | 15.8% |
| Range | 13.1% | 11.9% |
| Mean | 5.8% | 6.3% |
| Median | 5.8% | 5.8% |
| Interquartile 25% (IQ1) | 4.1% | 4.6% |
| Interquartile 75% (IQ3) | 7.2% | 7.4% |
| Interquartile Range (IQR) | 3.1% | 2.8% |
| Standard Deviation (Sample) | 2.6% | 2.2% |
| Standard Deviation (Population) | 2.5% | 2.2% |
Similar Demographics by Unemployment
Demographics Similar to Immigrants from St. Vincent and the Grenadines by Unemployment
In terms of unemployment, the demographic groups most similar to Immigrants from St. Vincent and the Grenadines are Immigrants from Guyana (6.9%, a difference of 0.010%), Guyanese (6.9%, a difference of 0.050%), Immigrants from Grenada (6.9%, a difference of 0.37%), British West Indian (6.8%, a difference of 0.79%), and Immigrants from Cabo Verde (6.8%, a difference of 1.0%).
| Demographics | Rating | Rank | Unemployment |
| Immigrants | Barbados | 0.0 /100 | #313 | Tragic 6.6% |
| Blacks/African Americans | 0.0 /100 | #314 | Tragic 6.6% |
| Houma | 0.0 /100 | #315 | Tragic 6.7% |
| Immigrants | Dominica | 0.0 /100 | #316 | Tragic 6.7% |
| Shoshone | 0.0 /100 | #317 | Tragic 6.8% |
| Immigrants | Cabo Verde | 0.0 /100 | #318 | Tragic 6.8% |
| British West Indians | 0.0 /100 | #319 | Tragic 6.8% |
| Immigrants | St. Vincent and the Grenadines | 0.0 /100 | #320 | Tragic 6.9% |
| Immigrants | Guyana | 0.0 /100 | #321 | Tragic 6.9% |
| Guyanese | 0.0 /100 | #322 | Tragic 6.9% |
| Immigrants | Grenada | 0.0 /100 | #323 | Tragic 6.9% |
| Immigrants | Armenia | 0.0 /100 | #324 | Tragic 7.0% |
| Natives/Alaskans | 0.0 /100 | #325 | Tragic 7.0% |
| Paiute | 0.0 /100 | #326 | Tragic 7.1% |
| Pueblo | 0.0 /100 | #327 | Tragic 7.2% |
Demographics Similar to Whites/Caucasians by Unemployment
In terms of unemployment, the demographic groups most similar to Whites/Caucasians are Immigrants from Belgium (4.9%, a difference of 0.010%), Immigrants from Zimbabwe (4.9%, a difference of 0.030%), Eastern European (4.9%, a difference of 0.060%), Australian (4.9%, a difference of 0.090%), and French Canadian (4.9%, a difference of 0.17%).
| Demographics | Rating | Rank | Unemployment |
| French | 99.5 /100 | #45 | Exceptional 4.8% |
| Immigrants | Nepal | 99.4 /100 | #46 | Exceptional 4.8% |
| Immigrants | Taiwan | 99.4 /100 | #47 | Exceptional 4.8% |
| Immigrants | Scotland | 99.3 /100 | #48 | Exceptional 4.9% |
| Immigrants | South Central Asia | 99.3 /100 | #49 | Exceptional 4.9% |
| French Canadians | 99.3 /100 | #50 | Exceptional 4.9% |
| Immigrants | Belgium | 99.2 /100 | #51 | Exceptional 4.9% |
| Whites/Caucasians | 99.2 /100 | #52 | Exceptional 4.9% |
| Immigrants | Zimbabwe | 99.2 /100 | #53 | Exceptional 4.9% |
| Eastern Europeans | 99.2 /100 | #54 | Exceptional 4.9% |
| Australians | 99.2 /100 | #55 | Exceptional 4.9% |
| Celtics | 99.1 /100 | #56 | Exceptional 4.9% |
| Immigrants | Singapore | 99.1 /100 | #57 | Exceptional 4.9% |
| Greeks | 99.0 /100 | #58 | Exceptional 4.9% |
| Bhutanese | 99.0 /100 | #59 | Exceptional 4.9% |