Immigrants from Sierra Leone vs White/Caucasian Unemployment
COMPARE
Immigrants from Sierra Leone
White/Caucasian
Unemployment
Unemployment Comparison
Immigrants from Sierra Leone
Whites/Caucasians
5.8%
UNEMPLOYMENT
0.1/ 100
METRIC RATING
268th/ 347
METRIC RANK
4.9%
UNEMPLOYMENT
99.2/ 100
METRIC RATING
52nd/ 347
METRIC RANK
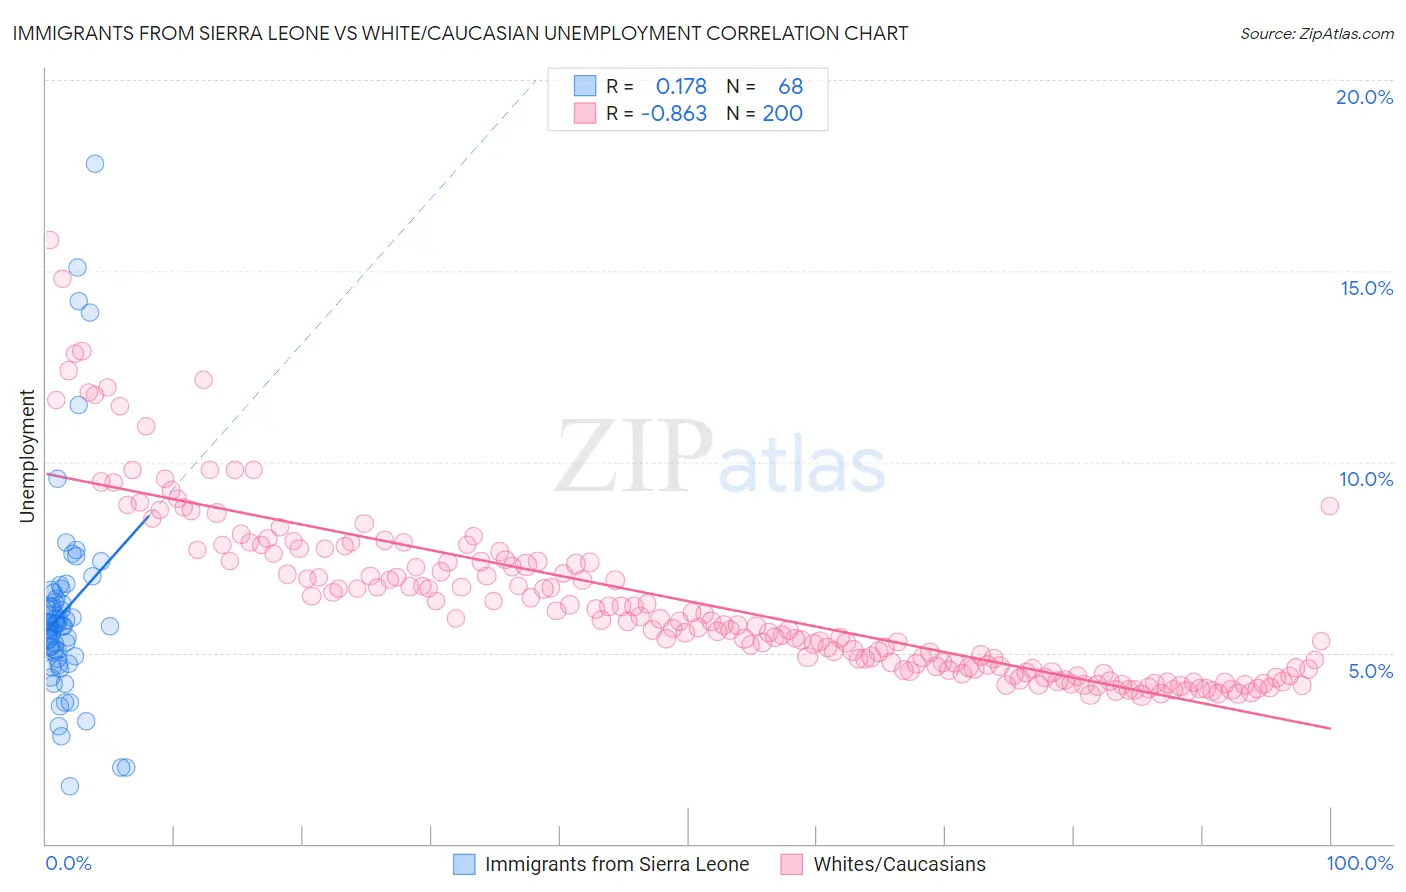
Immigrants from Sierra Leone vs White/Caucasian Unemployment Correlation Chart
The statistical analysis conducted on geographies consisting of 101,634,526 people shows a poor positive correlation between the proportion of Immigrants from Sierra Leone and unemployment in the United States with a correlation coefficient (R) of 0.178 and weighted average of 5.8%. Similarly, the statistical analysis conducted on geographies consisting of 578,869,025 people shows a very strong negative correlation between the proportion of Whites/Caucasians and unemployment in the United States with a correlation coefficient (R) of -0.863 and weighted average of 4.9%, a difference of 20.0%.
Unemployment Correlation Summary
| Measurement | Immigrants from Sierra Leone | White/Caucasian |
| Minimum | 1.5% | 3.9% |
| Maximum | 17.8% | 15.8% |
| Range | 16.3% | 11.9% |
| Mean | 6.1% | 6.3% |
| Median | 5.7% | 5.8% |
| Interquartile 25% (IQ1) | 4.9% | 4.6% |
| Interquartile 75% (IQ3) | 6.5% | 7.4% |
| Interquartile Range (IQR) | 1.6% | 2.8% |
| Standard Deviation (Sample) | 2.8% | 2.2% |
| Standard Deviation (Population) | 2.8% | 2.2% |
Similar Demographics by Unemployment
Demographics Similar to Immigrants from Sierra Leone by Unemployment
In terms of unemployment, the demographic groups most similar to Immigrants from Sierra Leone are Immigrants from El Salvador (5.8%, a difference of 0.010%), Immigrants from Nigeria (5.8%, a difference of 0.040%), Blackfeet (5.8%, a difference of 0.090%), Mexican American Indian (5.8%, a difference of 0.11%), and Mexican (5.9%, a difference of 0.32%).
| Demographics | Rating | Rank | Unemployment |
| Immigrants | Guatemala | 0.1 /100 | #261 | Tragic 5.8% |
| Sierra Leoneans | 0.1 /100 | #262 | Tragic 5.8% |
| Salvadorans | 0.1 /100 | #263 | Tragic 5.8% |
| Immigrants | Liberia | 0.1 /100 | #264 | Tragic 5.8% |
| Nigerians | 0.1 /100 | #265 | Tragic 5.8% |
| Mexican American Indians | 0.1 /100 | #266 | Tragic 5.8% |
| Immigrants | Nigeria | 0.1 /100 | #267 | Tragic 5.8% |
| Immigrants | Sierra Leone | 0.1 /100 | #268 | Tragic 5.8% |
| Immigrants | El Salvador | 0.1 /100 | #269 | Tragic 5.8% |
| Blackfeet | 0.1 /100 | #270 | Tragic 5.8% |
| Mexicans | 0.1 /100 | #271 | Tragic 5.9% |
| Hispanics or Latinos | 0.0 /100 | #272 | Tragic 5.9% |
| Immigrants | Fiji | 0.0 /100 | #273 | Tragic 5.9% |
| Bahamians | 0.0 /100 | #274 | Tragic 5.9% |
| Immigrants | Latin America | 0.0 /100 | #275 | Tragic 5.9% |
Demographics Similar to Whites/Caucasians by Unemployment
In terms of unemployment, the demographic groups most similar to Whites/Caucasians are Immigrants from Belgium (4.9%, a difference of 0.010%), Immigrants from Zimbabwe (4.9%, a difference of 0.030%), Eastern European (4.9%, a difference of 0.060%), Australian (4.9%, a difference of 0.090%), and French Canadian (4.9%, a difference of 0.17%).
| Demographics | Rating | Rank | Unemployment |
| French | 99.5 /100 | #45 | Exceptional 4.8% |
| Immigrants | Nepal | 99.4 /100 | #46 | Exceptional 4.8% |
| Immigrants | Taiwan | 99.4 /100 | #47 | Exceptional 4.8% |
| Immigrants | Scotland | 99.3 /100 | #48 | Exceptional 4.9% |
| Immigrants | South Central Asia | 99.3 /100 | #49 | Exceptional 4.9% |
| French Canadians | 99.3 /100 | #50 | Exceptional 4.9% |
| Immigrants | Belgium | 99.2 /100 | #51 | Exceptional 4.9% |
| Whites/Caucasians | 99.2 /100 | #52 | Exceptional 4.9% |
| Immigrants | Zimbabwe | 99.2 /100 | #53 | Exceptional 4.9% |
| Eastern Europeans | 99.2 /100 | #54 | Exceptional 4.9% |
| Australians | 99.2 /100 | #55 | Exceptional 4.9% |
| Celtics | 99.1 /100 | #56 | Exceptional 4.9% |
| Immigrants | Singapore | 99.1 /100 | #57 | Exceptional 4.9% |
| Greeks | 99.0 /100 | #58 | Exceptional 4.9% |
| Bhutanese | 99.0 /100 | #59 | Exceptional 4.9% |