Immigrants from St. Vincent and the Grenadines vs Crow Unemployment
COMPARE
Immigrants from St. Vincent and the Grenadines
Crow
Unemployment
Unemployment Comparison
Immigrants from St. Vincent and the Grenadines
Crow
6.9%
UNEMPLOYMENT
0.0/ 100
METRIC RATING
320th/ 347
METRIC RANK
11.1%
UNEMPLOYMENT
0.0/ 100
METRIC RATING
346th/ 347
METRIC RANK
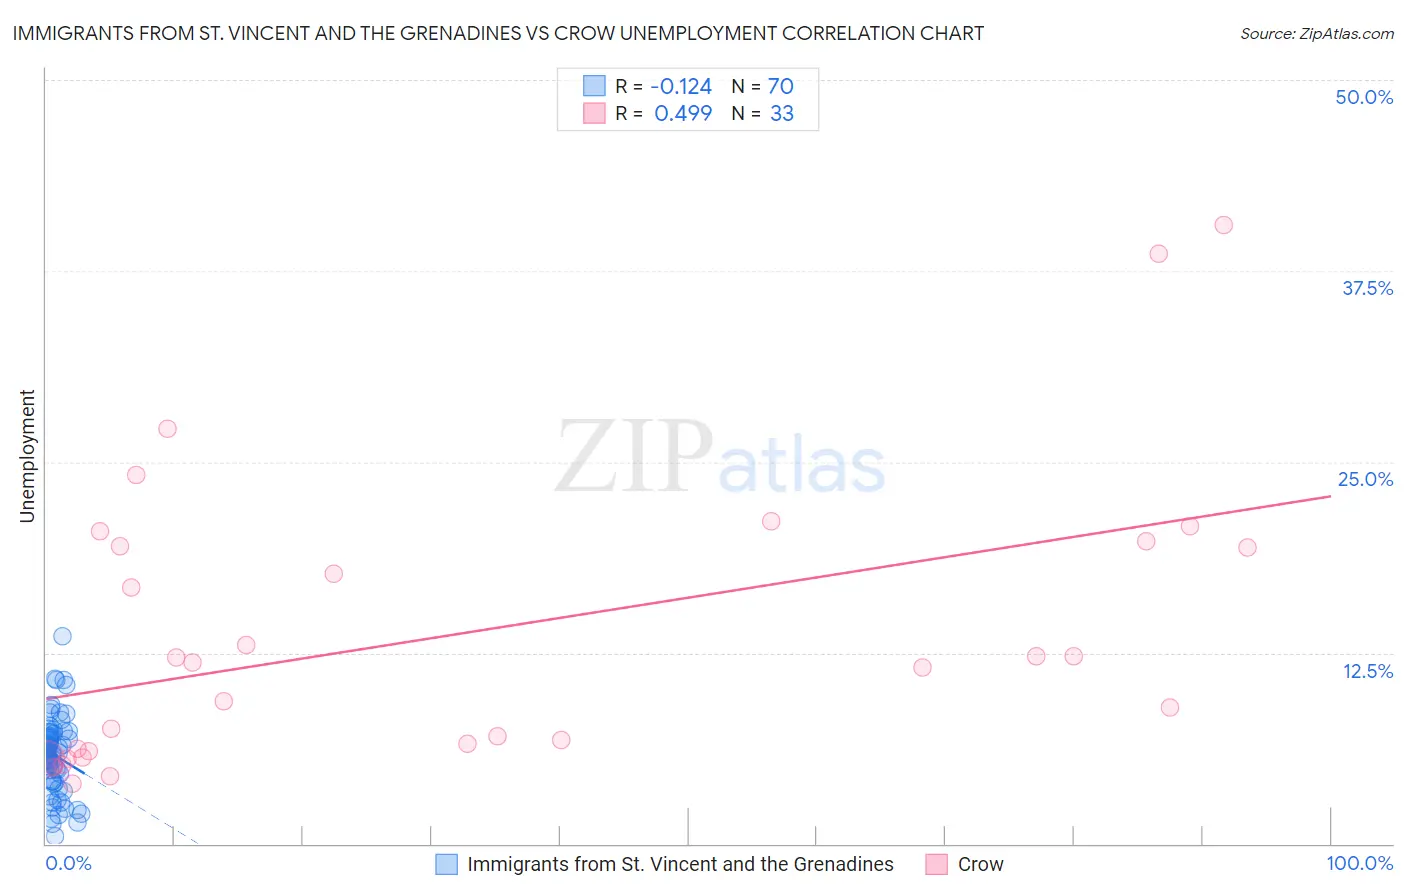
Immigrants from St. Vincent and the Grenadines vs Crow Unemployment Correlation Chart
The statistical analysis conducted on geographies consisting of 56,184,646 people shows a poor negative correlation between the proportion of Immigrants from St. Vincent and the Grenadines and unemployment in the United States with a correlation coefficient (R) of -0.124 and weighted average of 6.9%. Similarly, the statistical analysis conducted on geographies consisting of 59,183,327 people shows a moderate positive correlation between the proportion of Crow and unemployment in the United States with a correlation coefficient (R) of 0.499 and weighted average of 11.1%, a difference of 60.6%.
Unemployment Correlation Summary
| Measurement | Immigrants from St. Vincent and the Grenadines | Crow |
| Minimum | 0.50% | 3.9% |
| Maximum | 13.6% | 40.5% |
| Range | 13.1% | 36.6% |
| Mean | 5.8% | 13.7% |
| Median | 5.8% | 11.9% |
| Interquartile 25% (IQ1) | 4.1% | 6.1% |
| Interquartile 75% (IQ3) | 7.2% | 19.6% |
| Interquartile Range (IQR) | 3.1% | 13.5% |
| Standard Deviation (Sample) | 2.6% | 9.3% |
| Standard Deviation (Population) | 2.5% | 9.2% |
Similar Demographics by Unemployment
Demographics Similar to Immigrants from St. Vincent and the Grenadines by Unemployment
In terms of unemployment, the demographic groups most similar to Immigrants from St. Vincent and the Grenadines are Immigrants from Guyana (6.9%, a difference of 0.010%), Guyanese (6.9%, a difference of 0.050%), Immigrants from Grenada (6.9%, a difference of 0.37%), British West Indian (6.8%, a difference of 0.79%), and Immigrants from Cabo Verde (6.8%, a difference of 1.0%).
| Demographics | Rating | Rank | Unemployment |
| Immigrants | Barbados | 0.0 /100 | #313 | Tragic 6.6% |
| Blacks/African Americans | 0.0 /100 | #314 | Tragic 6.6% |
| Houma | 0.0 /100 | #315 | Tragic 6.7% |
| Immigrants | Dominica | 0.0 /100 | #316 | Tragic 6.7% |
| Shoshone | 0.0 /100 | #317 | Tragic 6.8% |
| Immigrants | Cabo Verde | 0.0 /100 | #318 | Tragic 6.8% |
| British West Indians | 0.0 /100 | #319 | Tragic 6.8% |
| Immigrants | St. Vincent and the Grenadines | 0.0 /100 | #320 | Tragic 6.9% |
| Immigrants | Guyana | 0.0 /100 | #321 | Tragic 6.9% |
| Guyanese | 0.0 /100 | #322 | Tragic 6.9% |
| Immigrants | Grenada | 0.0 /100 | #323 | Tragic 6.9% |
| Immigrants | Armenia | 0.0 /100 | #324 | Tragic 7.0% |
| Natives/Alaskans | 0.0 /100 | #325 | Tragic 7.0% |
| Paiute | 0.0 /100 | #326 | Tragic 7.1% |
| Pueblo | 0.0 /100 | #327 | Tragic 7.2% |
Demographics Similar to Crow by Unemployment
In terms of unemployment, the demographic groups most similar to Crow are Inupiat (10.1%, a difference of 9.4%), Arapaho (9.8%, a difference of 12.6%), Yuman (9.1%, a difference of 22.0%), Yup'ik (13.6%, a difference of 23.3%), and Hopi (8.9%, a difference of 24.1%).
| Demographics | Rating | Rank | Unemployment |
| Immigrants | Dominican Republic | 0.0 /100 | #333 | Tragic 7.4% |
| Apache | 0.0 /100 | #334 | Tragic 7.4% |
| Alaskan Athabascans | 0.0 /100 | #335 | Tragic 7.7% |
| Immigrants | Yemen | 0.0 /100 | #336 | Tragic 7.7% |
| Cheyenne | 0.0 /100 | #337 | Tragic 8.0% |
| Pima | 0.0 /100 | #338 | Tragic 8.2% |
| Navajo | 0.0 /100 | #339 | Tragic 8.4% |
| Puerto Ricans | 0.0 /100 | #340 | Tragic 8.4% |
| Tohono O'odham | 0.0 /100 | #341 | Tragic 8.9% |
| Hopi | 0.0 /100 | #342 | Tragic 8.9% |
| Yuman | 0.0 /100 | #343 | Tragic 9.1% |
| Arapaho | 0.0 /100 | #344 | Tragic 9.8% |
| Inupiat | 0.0 /100 | #345 | Tragic 10.1% |
| Crow | 0.0 /100 | #346 | Tragic 11.1% |
| Yup'ik | 0.0 /100 | #347 | Tragic 13.6% |