Houma vs White/Caucasian Unemployment
COMPARE
Houma
White/Caucasian
Unemployment
Unemployment Comparison
Houma
Whites/Caucasians
6.7%
UNEMPLOYMENT
0.0/ 100
METRIC RATING
315th/ 347
METRIC RANK
4.9%
UNEMPLOYMENT
99.2/ 100
METRIC RATING
52nd/ 347
METRIC RANK
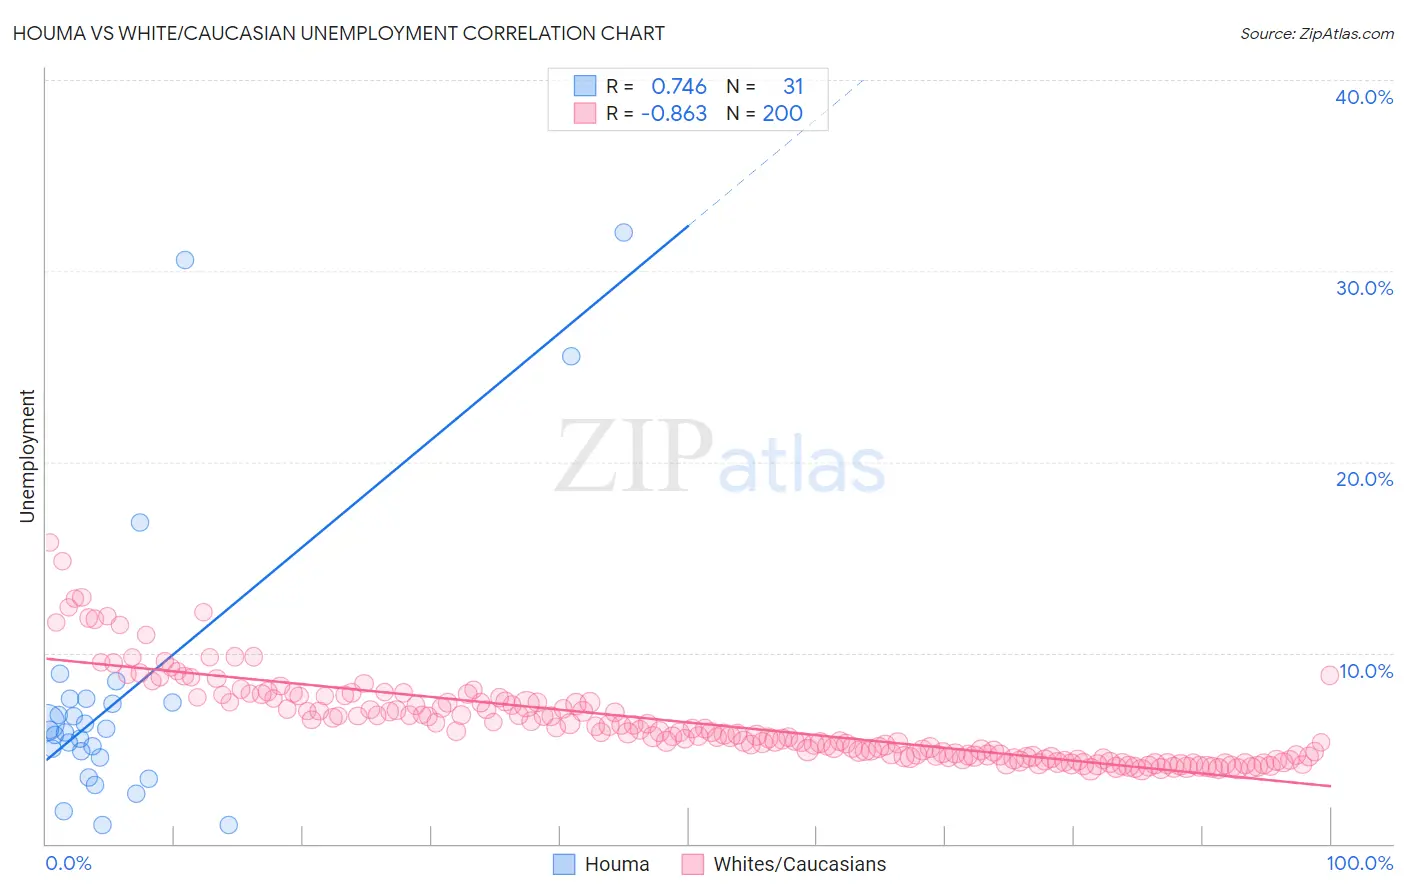
Houma vs White/Caucasian Unemployment Correlation Chart
The statistical analysis conducted on geographies consisting of 36,775,803 people shows a strong positive correlation between the proportion of Houma and unemployment in the United States with a correlation coefficient (R) of 0.746 and weighted average of 6.7%. Similarly, the statistical analysis conducted on geographies consisting of 578,869,025 people shows a very strong negative correlation between the proportion of Whites/Caucasians and unemployment in the United States with a correlation coefficient (R) of -0.863 and weighted average of 4.9%, a difference of 37.4%.
Unemployment Correlation Summary
| Measurement | Houma | White/Caucasian |
| Minimum | 1.0% | 3.9% |
| Maximum | 32.0% | 15.8% |
| Range | 31.0% | 11.9% |
| Mean | 8.0% | 6.3% |
| Median | 6.0% | 5.8% |
| Interquartile 25% (IQ1) | 4.5% | 4.6% |
| Interquartile 75% (IQ3) | 7.6% | 7.4% |
| Interquartile Range (IQR) | 3.1% | 2.8% |
| Standard Deviation (Sample) | 7.7% | 2.2% |
| Standard Deviation (Population) | 7.6% | 2.2% |
Similar Demographics by Unemployment
Demographics Similar to Houma by Unemployment
In terms of unemployment, the demographic groups most similar to Houma are Black/African American (6.6%, a difference of 0.80%), Immigrants from Dominica (6.7%, a difference of 0.83%), Immigrants from Barbados (6.6%, a difference of 1.3%), Shoshone (6.8%, a difference of 1.4%), and Colville (6.6%, a difference of 1.7%).
| Demographics | Rating | Rank | Unemployment |
| Barbadians | 0.0 /100 | #308 | Tragic 6.5% |
| Vietnamese | 0.0 /100 | #309 | Tragic 6.5% |
| Immigrants | Belize | 0.0 /100 | #310 | Tragic 6.5% |
| Cape Verdeans | 0.0 /100 | #311 | Tragic 6.5% |
| Colville | 0.0 /100 | #312 | Tragic 6.6% |
| Immigrants | Barbados | 0.0 /100 | #313 | Tragic 6.6% |
| Blacks/African Americans | 0.0 /100 | #314 | Tragic 6.6% |
| Houma | 0.0 /100 | #315 | Tragic 6.7% |
| Immigrants | Dominica | 0.0 /100 | #316 | Tragic 6.7% |
| Shoshone | 0.0 /100 | #317 | Tragic 6.8% |
| Immigrants | Cabo Verde | 0.0 /100 | #318 | Tragic 6.8% |
| British West Indians | 0.0 /100 | #319 | Tragic 6.8% |
| Immigrants | St. Vincent and the Grenadines | 0.0 /100 | #320 | Tragic 6.9% |
| Immigrants | Guyana | 0.0 /100 | #321 | Tragic 6.9% |
| Guyanese | 0.0 /100 | #322 | Tragic 6.9% |
Demographics Similar to Whites/Caucasians by Unemployment
In terms of unemployment, the demographic groups most similar to Whites/Caucasians are Immigrants from Belgium (4.9%, a difference of 0.010%), Immigrants from Zimbabwe (4.9%, a difference of 0.030%), Eastern European (4.9%, a difference of 0.060%), Australian (4.9%, a difference of 0.090%), and French Canadian (4.9%, a difference of 0.17%).
| Demographics | Rating | Rank | Unemployment |
| French | 99.5 /100 | #45 | Exceptional 4.8% |
| Immigrants | Nepal | 99.4 /100 | #46 | Exceptional 4.8% |
| Immigrants | Taiwan | 99.4 /100 | #47 | Exceptional 4.8% |
| Immigrants | Scotland | 99.3 /100 | #48 | Exceptional 4.9% |
| Immigrants | South Central Asia | 99.3 /100 | #49 | Exceptional 4.9% |
| French Canadians | 99.3 /100 | #50 | Exceptional 4.9% |
| Immigrants | Belgium | 99.2 /100 | #51 | Exceptional 4.9% |
| Whites/Caucasians | 99.2 /100 | #52 | Exceptional 4.9% |
| Immigrants | Zimbabwe | 99.2 /100 | #53 | Exceptional 4.9% |
| Eastern Europeans | 99.2 /100 | #54 | Exceptional 4.9% |
| Australians | 99.2 /100 | #55 | Exceptional 4.9% |
| Celtics | 99.1 /100 | #56 | Exceptional 4.9% |
| Immigrants | Singapore | 99.1 /100 | #57 | Exceptional 4.9% |
| Greeks | 99.0 /100 | #58 | Exceptional 4.9% |
| Bhutanese | 99.0 /100 | #59 | Exceptional 4.9% |