Immigrants from St. Vincent and the Grenadines vs White/Caucasian Median Earnings
COMPARE
Immigrants from St. Vincent and the Grenadines
White/Caucasian
Median Earnings
Median Earnings Comparison
Immigrants from St. Vincent and the Grenadines
Whites/Caucasians
$45,908
MEDIAN EARNINGS
32.4/ 100
METRIC RATING
195th/ 347
METRIC RANK
$45,197
MEDIAN EARNINGS
15.0/ 100
METRIC RATING
223rd/ 347
METRIC RANK
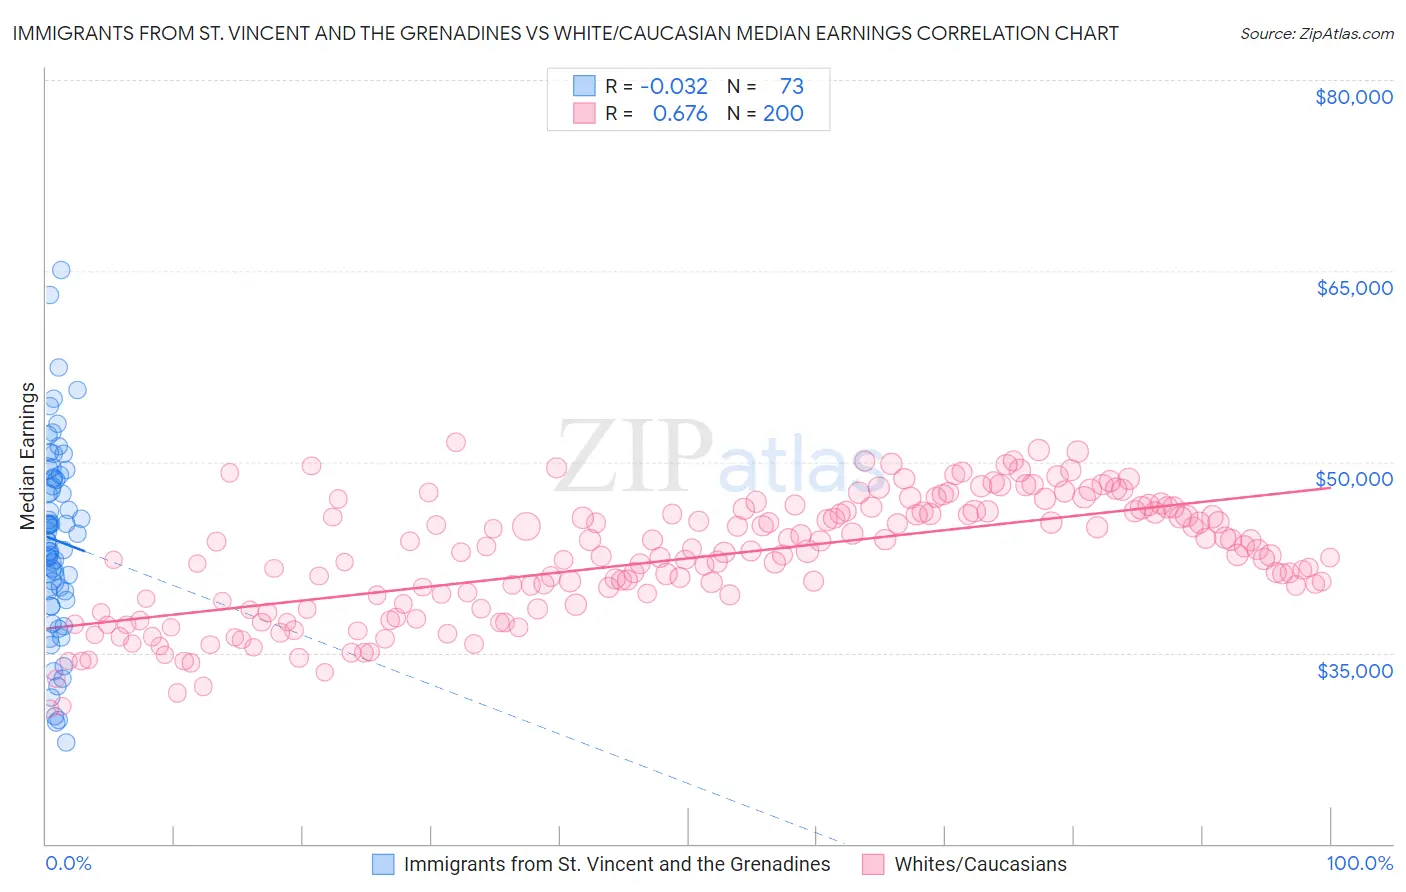
Immigrants from St. Vincent and the Grenadines vs White/Caucasian Median Earnings Correlation Chart
The statistical analysis conducted on geographies consisting of 56,194,678 people shows no correlation between the proportion of Immigrants from St. Vincent and the Grenadines and median earnings in the United States with a correlation coefficient (R) of -0.032 and weighted average of $45,908. Similarly, the statistical analysis conducted on geographies consisting of 584,189,858 people shows a significant positive correlation between the proportion of Whites/Caucasians and median earnings in the United States with a correlation coefficient (R) of 0.676 and weighted average of $45,197, a difference of 1.6%.
Median Earnings Correlation Summary
| Measurement | Immigrants from St. Vincent and the Grenadines | White/Caucasian |
| Minimum | $27,951 | $30,625 |
| Maximum | $65,069 | $51,538 |
| Range | $37,118 | $20,913 |
| Mean | $43,851 | $42,432 |
| Median | $43,770 | $42,807 |
| Interquartile 25% (IQ1) | $39,492 | $38,641 |
| Interquartile 75% (IQ3) | $48,733 | $46,089 |
| Interquartile Range (IQR) | $9,241 | $7,448 |
| Standard Deviation (Sample) | $7,478 | $4,733 |
| Standard Deviation (Population) | $7,427 | $4,721 |
Similar Demographics by Median Earnings
Demographics Similar to Immigrants from St. Vincent and the Grenadines by Median Earnings
In terms of median earnings, the demographic groups most similar to Immigrants from St. Vincent and the Grenadines are Immigrants from Costa Rica ($45,928, a difference of 0.040%), German ($45,935, a difference of 0.060%), Guamanian/Chamorro ($45,933, a difference of 0.060%), Finnish ($45,940, a difference of 0.070%), and Yugoslavian ($45,846, a difference of 0.13%).
| Demographics | Rating | Rank | Median Earnings |
| Immigrants | Armenia | 38.3 /100 | #188 | Fair $46,094 |
| Spaniards | 37.2 /100 | #189 | Fair $46,059 |
| French Canadians | 36.1 /100 | #190 | Fair $46,026 |
| Finns | 33.4 /100 | #191 | Fair $45,940 |
| Germans | 33.2 /100 | #192 | Fair $45,935 |
| Guamanians/Chamorros | 33.2 /100 | #193 | Fair $45,933 |
| Immigrants | Costa Rica | 33.0 /100 | #194 | Fair $45,928 |
| Immigrants | St. Vincent and the Grenadines | 32.4 /100 | #195 | Fair $45,908 |
| Yugoslavians | 30.5 /100 | #196 | Fair $45,846 |
| Barbadians | 30.5 /100 | #197 | Fair $45,846 |
| Trinidadians and Tobagonians | 29.7 /100 | #198 | Fair $45,820 |
| Immigrants | Barbados | 29.6 /100 | #199 | Fair $45,816 |
| Immigrants | Azores | 29.5 /100 | #200 | Fair $45,812 |
| Celtics | 27.2 /100 | #201 | Fair $45,732 |
| Immigrants | Trinidad and Tobago | 27.1 /100 | #202 | Fair $45,729 |
Demographics Similar to Whites/Caucasians by Median Earnings
In terms of median earnings, the demographic groups most similar to Whites/Caucasians are Immigrants from Panama ($45,198, a difference of 0.0%), Immigrants from Guyana ($45,204, a difference of 0.020%), Ecuadorian ($45,214, a difference of 0.040%), West Indian ($45,132, a difference of 0.15%), and Immigrants from Cambodia ($45,090, a difference of 0.24%).
| Demographics | Rating | Rank | Median Earnings |
| Guyanese | 20.6 /100 | #216 | Fair $45,470 |
| Tlingit-Haida | 20.5 /100 | #217 | Fair $45,468 |
| Spanish | 19.7 /100 | #218 | Poor $45,432 |
| Dutch | 18.4 /100 | #219 | Poor $45,370 |
| Ecuadorians | 15.3 /100 | #220 | Poor $45,214 |
| Immigrants | Guyana | 15.1 /100 | #221 | Poor $45,204 |
| Immigrants | Panama | 15.0 /100 | #222 | Poor $45,198 |
| Whites/Caucasians | 15.0 /100 | #223 | Poor $45,197 |
| West Indians | 13.9 /100 | #224 | Poor $45,132 |
| Immigrants | Cambodia | 13.2 /100 | #225 | Poor $45,090 |
| Immigrants | Nigeria | 12.2 /100 | #226 | Poor $45,030 |
| Native Hawaiians | 12.2 /100 | #227 | Poor $45,027 |
| Immigrants | Iraq | 11.6 /100 | #228 | Poor $44,988 |
| Scotch-Irish | 10.7 /100 | #229 | Poor $44,924 |
| Immigrants | Western Africa | 10.3 /100 | #230 | Poor $44,893 |