Immigrants from South Africa vs English Unemployment Among Women with Children Ages 6 to 17 years
COMPARE
Immigrants from South Africa
English
Unemployment Among Women with Children Ages 6 to 17 years
Unemployment Among Women with Children Ages 6 to 17 years Comparison
Immigrants from South Africa
English
8.6%
UNEMPLOYMENT AMONG WOMEN WITH CHILDREN AGES 6 TO 17 YEARS
98.3/ 100
METRIC RATING
102nd/ 347
METRIC RANK
9.4%
UNEMPLOYMENT AMONG WOMEN WITH CHILDREN AGES 6 TO 17 YEARS
1.9/ 100
METRIC RATING
244th/ 347
METRIC RANK
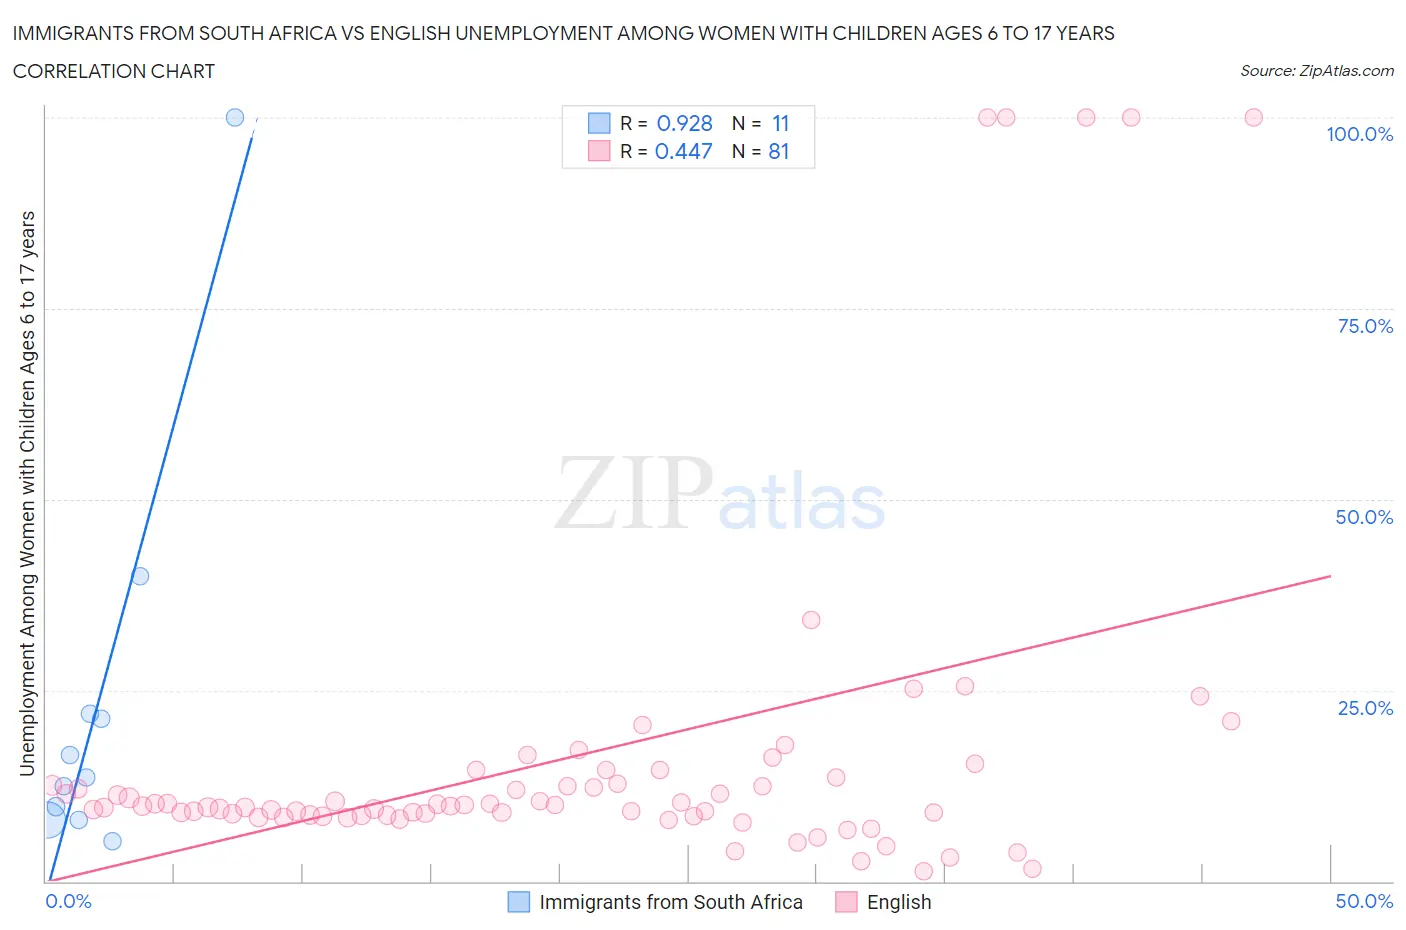
Immigrants from South Africa vs English Unemployment Among Women with Children Ages 6 to 17 years Correlation Chart
The statistical analysis conducted on geographies consisting of 179,401,659 people shows a near-perfect positive correlation between the proportion of Immigrants from South Africa and unemployment rate among women with children between the ages 6 and 17 in the United States with a correlation coefficient (R) of 0.928 and weighted average of 8.6%. Similarly, the statistical analysis conducted on geographies consisting of 358,817,794 people shows a moderate positive correlation between the proportion of English and unemployment rate among women with children between the ages 6 and 17 in the United States with a correlation coefficient (R) of 0.447 and weighted average of 9.4%, a difference of 9.3%.
Unemployment Among Women with Children Ages 6 to 17 years Correlation Summary
| Measurement | Immigrants from South Africa | English |
| Minimum | 5.3% | 1.3% |
| Maximum | 100.0% | 100.0% |
| Range | 94.7% | 98.7% |
| Mean | 23.4% | 16.4% |
| Median | 13.6% | 9.8% |
| Interquartile 25% (IQ1) | 8.1% | 8.6% |
| Interquartile 75% (IQ3) | 21.9% | 13.2% |
| Interquartile Range (IQR) | 13.8% | 4.6% |
| Standard Deviation (Sample) | 27.2% | 22.2% |
| Standard Deviation (Population) | 25.9% | 22.1% |
Similar Demographics by Unemployment Among Women with Children Ages 6 to 17 years
Demographics Similar to Immigrants from South Africa by Unemployment Among Women with Children Ages 6 to 17 years
In terms of unemployment among women with children ages 6 to 17 years, the demographic groups most similar to Immigrants from South Africa are Scandinavian (8.6%, a difference of 0.010%), Immigrants from Pakistan (8.6%, a difference of 0.020%), Immigrants from Lithuania (8.6%, a difference of 0.030%), New Zealander (8.6%, a difference of 0.030%), and Malaysian (8.6%, a difference of 0.10%).
| Demographics | Rating | Rank | Unemployment Among Women with Children Ages 6 to 17 years |
| Sri Lankans | 98.7 /100 | #95 | Exceptional 8.5% |
| German Russians | 98.6 /100 | #96 | Exceptional 8.5% |
| Bolivians | 98.5 /100 | #97 | Exceptional 8.5% |
| Malaysians | 98.5 /100 | #98 | Exceptional 8.6% |
| Immigrants | Lithuania | 98.4 /100 | #99 | Exceptional 8.6% |
| New Zealanders | 98.4 /100 | #100 | Exceptional 8.6% |
| Immigrants | Pakistan | 98.4 /100 | #101 | Exceptional 8.6% |
| Immigrants | South Africa | 98.3 /100 | #102 | Exceptional 8.6% |
| Scandinavians | 98.3 /100 | #103 | Exceptional 8.6% |
| Immigrants | France | 98.0 /100 | #104 | Exceptional 8.6% |
| Immigrants | Norway | 97.8 /100 | #105 | Exceptional 8.6% |
| Immigrants | Serbia | 97.7 /100 | #106 | Exceptional 8.6% |
| Chickasaw | 97.6 /100 | #107 | Exceptional 8.6% |
| Swedes | 97.6 /100 | #108 | Exceptional 8.6% |
| Immigrants | Romania | 97.5 /100 | #109 | Exceptional 8.6% |
Demographics Similar to English by Unemployment Among Women with Children Ages 6 to 17 years
In terms of unemployment among women with children ages 6 to 17 years, the demographic groups most similar to English are Immigrants from Cameroon (9.4%, a difference of 0.030%), Scottish (9.4%, a difference of 0.050%), Immigrants from Colombia (9.3%, a difference of 0.14%), Colombian (9.3%, a difference of 0.16%), and Immigrants from Africa (9.4%, a difference of 0.20%).
| Demographics | Rating | Rank | Unemployment Among Women with Children Ages 6 to 17 years |
| Immigrants | Belize | 2.8 /100 | #237 | Tragic 9.3% |
| Arabs | 2.7 /100 | #238 | Tragic 9.3% |
| Immigrants | Saudi Arabia | 2.7 /100 | #239 | Tragic 9.3% |
| Guatemalans | 2.3 /100 | #240 | Tragic 9.3% |
| Colombians | 2.2 /100 | #241 | Tragic 9.3% |
| Immigrants | Colombia | 2.1 /100 | #242 | Tragic 9.3% |
| Scottish | 2.0 /100 | #243 | Tragic 9.4% |
| English | 1.9 /100 | #244 | Tragic 9.4% |
| Immigrants | Cameroon | 1.8 /100 | #245 | Tragic 9.4% |
| Immigrants | Africa | 1.6 /100 | #246 | Tragic 9.4% |
| Poles | 1.5 /100 | #247 | Tragic 9.4% |
| Dutch | 1.5 /100 | #248 | Tragic 9.4% |
| Immigrants | South America | 1.5 /100 | #249 | Tragic 9.4% |
| Immigrants | Guatemala | 1.3 /100 | #250 | Tragic 9.4% |
| Central Americans | 1.3 /100 | #251 | Tragic 9.4% |