Immigrants from South Africa vs Korean Unemployment Among Women with Children Ages 6 to 17 years
COMPARE
Immigrants from South Africa
Korean
Unemployment Among Women with Children Ages 6 to 17 years
Unemployment Among Women with Children Ages 6 to 17 years Comparison
Immigrants from South Africa
Koreans
8.6%
UNEMPLOYMENT AMONG WOMEN WITH CHILDREN AGES 6 TO 17 YEARS
98.3/ 100
METRIC RATING
102nd/ 347
METRIC RANK
8.2%
UNEMPLOYMENT AMONG WOMEN WITH CHILDREN AGES 6 TO 17 YEARS
100.0/ 100
METRIC RATING
61st/ 347
METRIC RANK
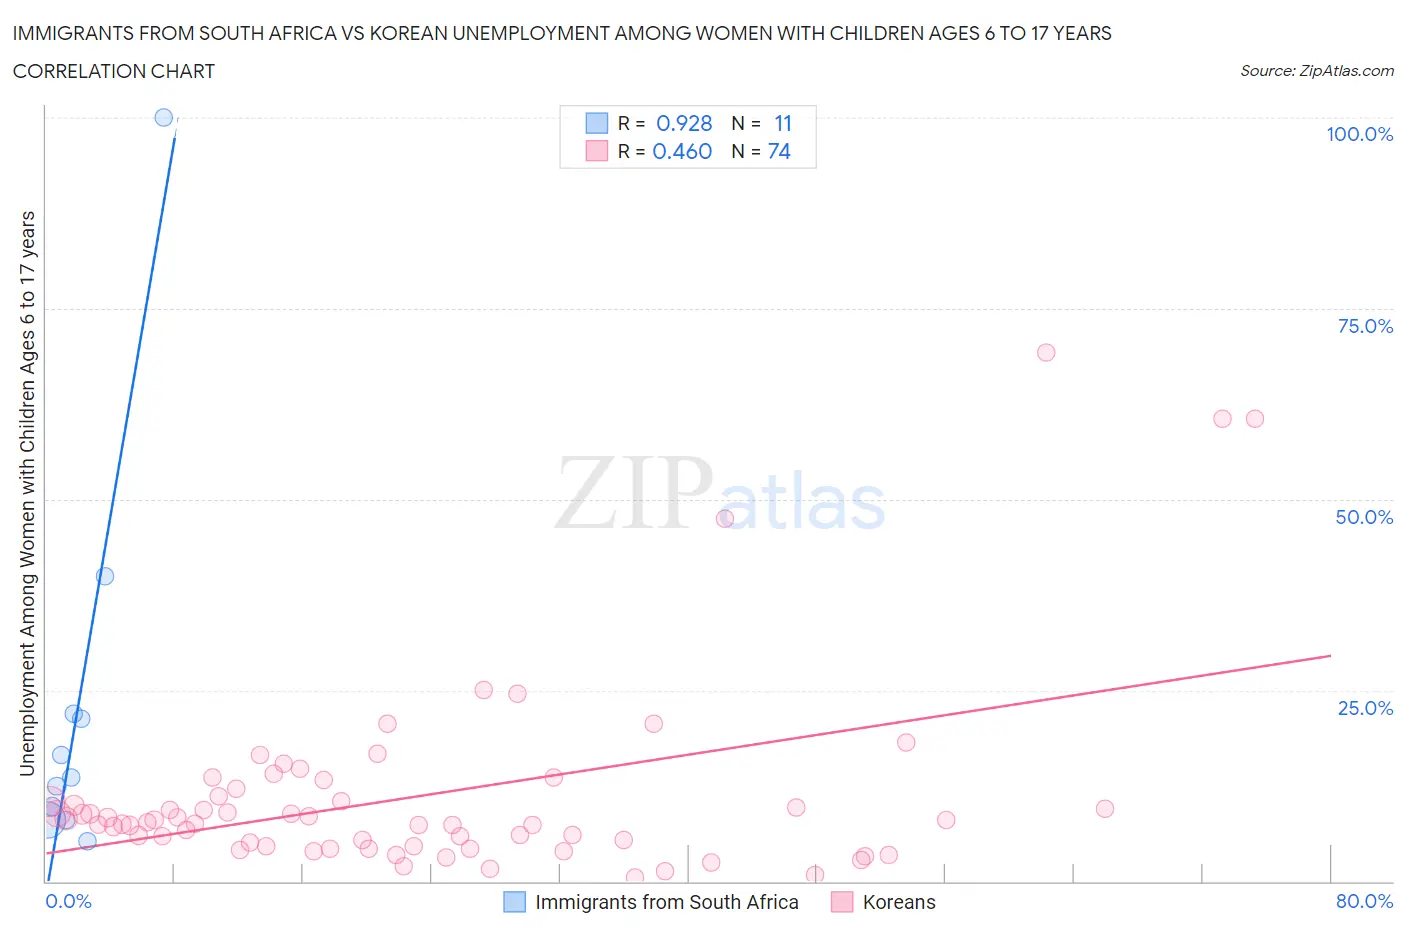
Immigrants from South Africa vs Korean Unemployment Among Women with Children Ages 6 to 17 years Correlation Chart
The statistical analysis conducted on geographies consisting of 179,401,659 people shows a near-perfect positive correlation between the proportion of Immigrants from South Africa and unemployment rate among women with children between the ages 6 and 17 in the United States with a correlation coefficient (R) of 0.928 and weighted average of 8.6%. Similarly, the statistical analysis conducted on geographies consisting of 342,207,280 people shows a moderate positive correlation between the proportion of Koreans and unemployment rate among women with children between the ages 6 and 17 in the United States with a correlation coefficient (R) of 0.460 and weighted average of 8.2%, a difference of 4.4%.
Unemployment Among Women with Children Ages 6 to 17 years Correlation Summary
| Measurement | Immigrants from South Africa | Korean |
| Minimum | 5.3% | 0.50% |
| Maximum | 100.0% | 69.2% |
| Range | 94.7% | 68.7% |
| Mean | 23.4% | 11.2% |
| Median | 13.6% | 7.9% |
| Interquartile 25% (IQ1) | 8.1% | 4.5% |
| Interquartile 75% (IQ3) | 21.9% | 11.2% |
| Interquartile Range (IQR) | 13.8% | 6.6% |
| Standard Deviation (Sample) | 27.2% | 12.8% |
| Standard Deviation (Population) | 25.9% | 12.8% |
Similar Demographics by Unemployment Among Women with Children Ages 6 to 17 years
Demographics Similar to Immigrants from South Africa by Unemployment Among Women with Children Ages 6 to 17 years
In terms of unemployment among women with children ages 6 to 17 years, the demographic groups most similar to Immigrants from South Africa are Scandinavian (8.6%, a difference of 0.010%), Immigrants from Pakistan (8.6%, a difference of 0.020%), Immigrants from Lithuania (8.6%, a difference of 0.030%), New Zealander (8.6%, a difference of 0.030%), and Malaysian (8.6%, a difference of 0.10%).
| Demographics | Rating | Rank | Unemployment Among Women with Children Ages 6 to 17 years |
| Sri Lankans | 98.7 /100 | #95 | Exceptional 8.5% |
| German Russians | 98.6 /100 | #96 | Exceptional 8.5% |
| Bolivians | 98.5 /100 | #97 | Exceptional 8.5% |
| Malaysians | 98.5 /100 | #98 | Exceptional 8.6% |
| Immigrants | Lithuania | 98.4 /100 | #99 | Exceptional 8.6% |
| New Zealanders | 98.4 /100 | #100 | Exceptional 8.6% |
| Immigrants | Pakistan | 98.4 /100 | #101 | Exceptional 8.6% |
| Immigrants | South Africa | 98.3 /100 | #102 | Exceptional 8.6% |
| Scandinavians | 98.3 /100 | #103 | Exceptional 8.6% |
| Immigrants | France | 98.0 /100 | #104 | Exceptional 8.6% |
| Immigrants | Norway | 97.8 /100 | #105 | Exceptional 8.6% |
| Immigrants | Serbia | 97.7 /100 | #106 | Exceptional 8.6% |
| Chickasaw | 97.6 /100 | #107 | Exceptional 8.6% |
| Swedes | 97.6 /100 | #108 | Exceptional 8.6% |
| Immigrants | Romania | 97.5 /100 | #109 | Exceptional 8.6% |
Demographics Similar to Koreans by Unemployment Among Women with Children Ages 6 to 17 years
In terms of unemployment among women with children ages 6 to 17 years, the demographic groups most similar to Koreans are Spanish American Indian (8.2%, a difference of 0.030%), Basque (8.2%, a difference of 0.18%), Immigrants from Philippines (8.2%, a difference of 0.19%), Immigrants from Malaysia (8.2%, a difference of 0.25%), and Immigrants from South Eastern Asia (8.2%, a difference of 0.43%).
| Demographics | Rating | Rank | Unemployment Among Women with Children Ages 6 to 17 years |
| Immigrants | Armenia | 100.0 /100 | #54 | Exceptional 8.2% |
| Immigrants | Japan | 100.0 /100 | #55 | Exceptional 8.2% |
| Immigrants | Bosnia and Herzegovina | 100.0 /100 | #56 | Exceptional 8.2% |
| Immigrants | Laos | 100.0 /100 | #57 | Exceptional 8.2% |
| Immigrants | Malaysia | 100.0 /100 | #58 | Exceptional 8.2% |
| Immigrants | Philippines | 100.0 /100 | #59 | Exceptional 8.2% |
| Basques | 100.0 /100 | #60 | Exceptional 8.2% |
| Koreans | 100.0 /100 | #61 | Exceptional 8.2% |
| Spanish American Indians | 100.0 /100 | #62 | Exceptional 8.2% |
| Immigrants | South Eastern Asia | 99.9 /100 | #63 | Exceptional 8.2% |
| Immigrants | Kuwait | 99.9 /100 | #64 | Exceptional 8.3% |
| Immigrants | Albania | 99.9 /100 | #65 | Exceptional 8.3% |
| Luxembourgers | 99.9 /100 | #66 | Exceptional 8.3% |
| Armenians | 99.9 /100 | #67 | Exceptional 8.3% |
| Marshallese | 99.9 /100 | #68 | Exceptional 8.3% |