Immigrants from South Africa vs English Disability Age 65 to 74
COMPARE
Immigrants from South Africa
English
Disability Age 65 to 74
Disability Age 65 to 74 Comparison
Immigrants from South Africa
English
21.7%
DISABILITY AGE 65 TO 74
99.3/ 100
METRIC RATING
67th/ 347
METRIC RANK
23.6%
DISABILITY AGE 65 TO 74
28.5/ 100
METRIC RATING
193rd/ 347
METRIC RANK
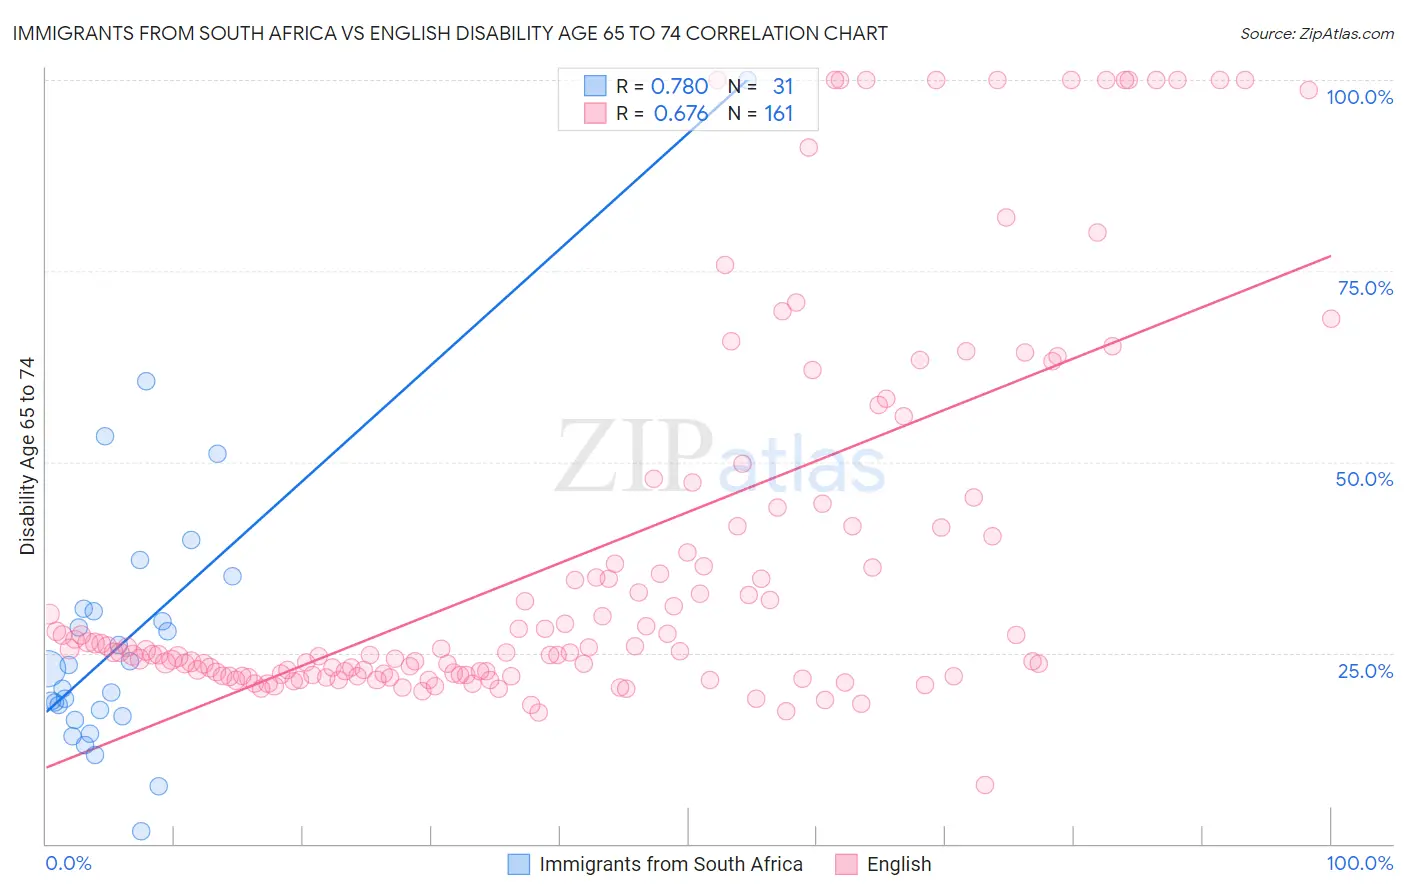
Immigrants from South Africa vs English Disability Age 65 to 74 Correlation Chart
The statistical analysis conducted on geographies consisting of 233,082,917 people shows a strong positive correlation between the proportion of Immigrants from South Africa and percentage of population with a disability between the ages 65 and 75 in the United States with a correlation coefficient (R) of 0.780 and weighted average of 21.7%. Similarly, the statistical analysis conducted on geographies consisting of 576,788,305 people shows a significant positive correlation between the proportion of English and percentage of population with a disability between the ages 65 and 75 in the United States with a correlation coefficient (R) of 0.676 and weighted average of 23.6%, a difference of 9.2%.
Disability Age 65 to 74 Correlation Summary
| Measurement | Immigrants from South Africa | English |
| Minimum | 1.7% | 7.7% |
| Maximum | 100.0% | 100.0% |
| Range | 98.3% | 92.3% |
| Mean | 27.3% | 37.7% |
| Median | 23.0% | 25.2% |
| Interquartile 25% (IQ1) | 16.7% | 22.1% |
| Interquartile 75% (IQ3) | 30.8% | 41.6% |
| Interquartile Range (IQR) | 14.2% | 19.4% |
| Standard Deviation (Sample) | 18.8% | 24.9% |
| Standard Deviation (Population) | 18.5% | 24.8% |
Similar Demographics by Disability Age 65 to 74
Demographics Similar to Immigrants from South Africa by Disability Age 65 to 74
In terms of disability age 65 to 74, the demographic groups most similar to Immigrants from South Africa are Immigrants from Scotland (21.7%, a difference of 0.090%), Maltese (21.6%, a difference of 0.20%), Immigrants from Russia (21.6%, a difference of 0.22%), Immigrants from Egypt (21.7%, a difference of 0.22%), and Immigrants from Latvia (21.6%, a difference of 0.23%).
| Demographics | Rating | Rank | Disability Age 65 to 74 |
| Immigrants | North Macedonia | 99.5 /100 | #60 | Exceptional 21.6% |
| Egyptians | 99.5 /100 | #61 | Exceptional 21.6% |
| Carpatho Rusyns | 99.5 /100 | #62 | Exceptional 21.6% |
| Immigrants | Europe | 99.4 /100 | #63 | Exceptional 21.6% |
| Immigrants | Latvia | 99.4 /100 | #64 | Exceptional 21.6% |
| Immigrants | Russia | 99.4 /100 | #65 | Exceptional 21.6% |
| Maltese | 99.4 /100 | #66 | Exceptional 21.6% |
| Immigrants | South Africa | 99.3 /100 | #67 | Exceptional 21.7% |
| Immigrants | Scotland | 99.3 /100 | #68 | Exceptional 21.7% |
| Immigrants | Egypt | 99.2 /100 | #69 | Exceptional 21.7% |
| Chinese | 99.2 /100 | #70 | Exceptional 21.7% |
| Immigrants | Belarus | 99.2 /100 | #71 | Exceptional 21.7% |
| Immigrants | Hungary | 99.2 /100 | #72 | Exceptional 21.7% |
| Immigrants | Venezuela | 99.0 /100 | #73 | Exceptional 21.8% |
| Cambodians | 99.0 /100 | #74 | Exceptional 21.8% |
Demographics Similar to English by Disability Age 65 to 74
In terms of disability age 65 to 74, the demographic groups most similar to English are Sudanese (23.7%, a difference of 0.050%), Ecuadorian (23.6%, a difference of 0.080%), Immigrants from Bangladesh (23.6%, a difference of 0.12%), Immigrants from St. Vincent and the Grenadines (23.7%, a difference of 0.18%), and Immigrants from Trinidad and Tobago (23.7%, a difference of 0.18%).
| Demographics | Rating | Rank | Disability Age 65 to 74 |
| Basques | 38.4 /100 | #186 | Fair 23.5% |
| Portuguese | 37.8 /100 | #187 | Fair 23.5% |
| Immigrants | Cuba | 34.0 /100 | #188 | Fair 23.6% |
| Scottish | 33.1 /100 | #189 | Fair 23.6% |
| Immigrants | Guyana | 31.2 /100 | #190 | Fair 23.6% |
| Immigrants | Bangladesh | 30.2 /100 | #191 | Fair 23.6% |
| Ecuadorians | 29.7 /100 | #192 | Fair 23.6% |
| English | 28.5 /100 | #193 | Fair 23.6% |
| Sudanese | 27.8 /100 | #194 | Fair 23.7% |
| Immigrants | St. Vincent and the Grenadines | 26.1 /100 | #195 | Fair 23.7% |
| Immigrants | Trinidad and Tobago | 26.1 /100 | #196 | Fair 23.7% |
| Immigrants | Immigrants | 25.8 /100 | #197 | Fair 23.7% |
| Immigrants | Africa | 24.4 /100 | #198 | Fair 23.7% |
| Welsh | 24.3 /100 | #199 | Fair 23.7% |
| French Canadians | 24.0 /100 | #200 | Fair 23.7% |