Immigrants from South Africa vs Immigrants from Belarus Unemployment Among Women with Children Ages 6 to 17 years
COMPARE
Immigrants from South Africa
Immigrants from Belarus
Unemployment Among Women with Children Ages 6 to 17 years
Unemployment Among Women with Children Ages 6 to 17 years Comparison
Immigrants from South Africa
Immigrants from Belarus
8.6%
UNEMPLOYMENT AMONG WOMEN WITH CHILDREN AGES 6 TO 17 YEARS
98.3/ 100
METRIC RATING
102nd/ 347
METRIC RANK
8.4%
UNEMPLOYMENT AMONG WOMEN WITH CHILDREN AGES 6 TO 17 YEARS
99.6/ 100
METRIC RATING
80th/ 347
METRIC RANK
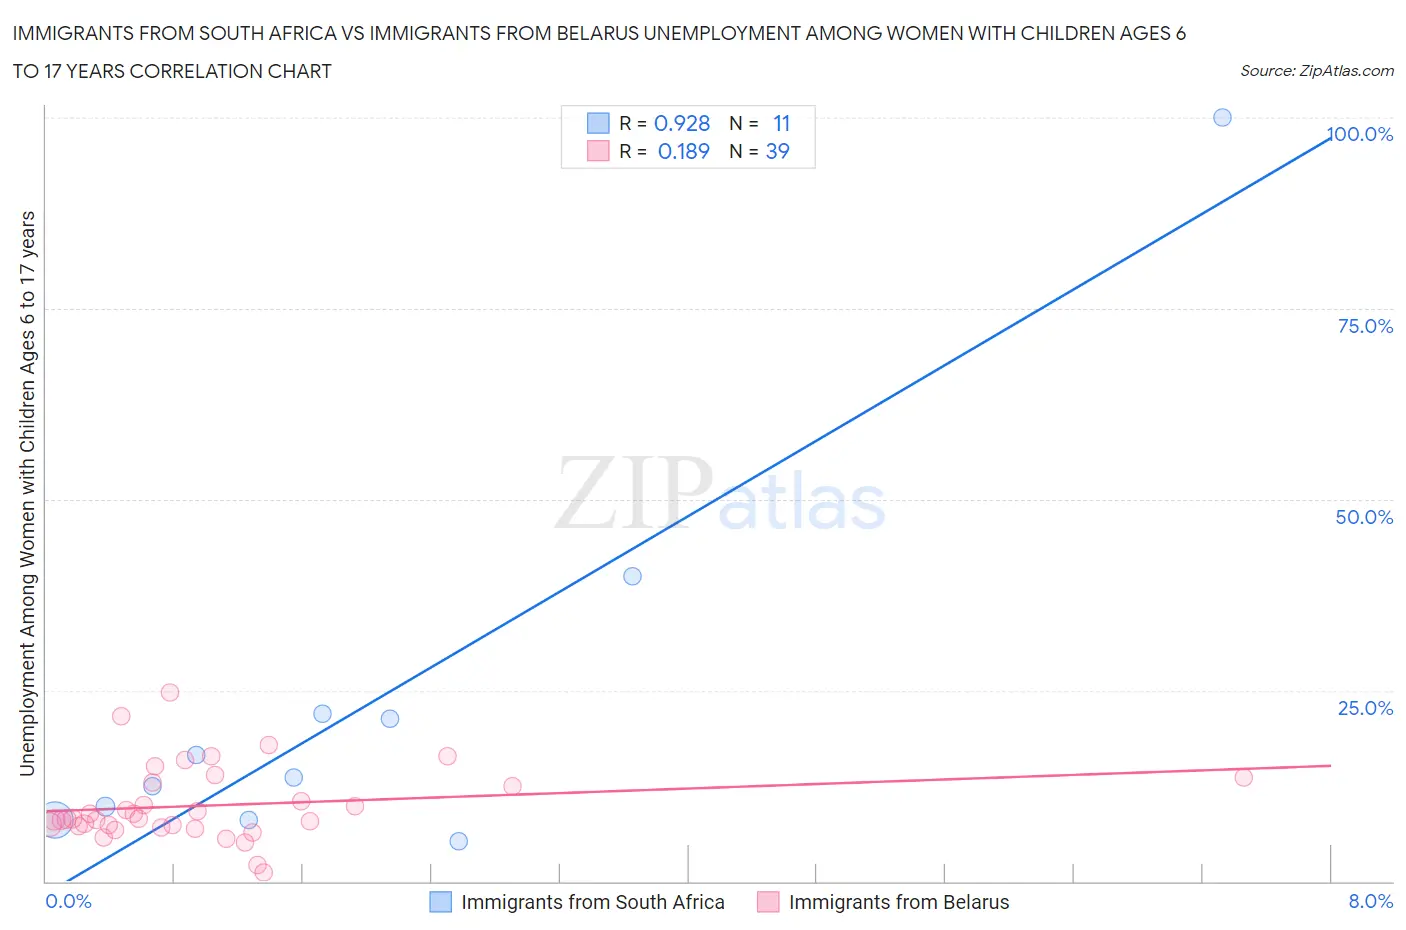
Immigrants from South Africa vs Immigrants from Belarus Unemployment Among Women with Children Ages 6 to 17 years Correlation Chart
The statistical analysis conducted on geographies consisting of 179,401,659 people shows a near-perfect positive correlation between the proportion of Immigrants from South Africa and unemployment rate among women with children between the ages 6 and 17 in the United States with a correlation coefficient (R) of 0.928 and weighted average of 8.6%. Similarly, the statistical analysis conducted on geographies consisting of 123,184,554 people shows a poor positive correlation between the proportion of Immigrants from Belarus and unemployment rate among women with children between the ages 6 and 17 in the United States with a correlation coefficient (R) of 0.189 and weighted average of 8.4%, a difference of 1.8%.
Unemployment Among Women with Children Ages 6 to 17 years Correlation Summary
| Measurement | Immigrants from South Africa | Immigrants from Belarus |
| Minimum | 5.3% | 1.1% |
| Maximum | 100.0% | 24.7% |
| Range | 94.7% | 23.6% |
| Mean | 23.4% | 9.9% |
| Median | 13.6% | 8.2% |
| Interquartile 25% (IQ1) | 8.1% | 7.1% |
| Interquartile 75% (IQ3) | 21.9% | 12.9% |
| Interquartile Range (IQR) | 13.8% | 5.7% |
| Standard Deviation (Sample) | 27.2% | 4.9% |
| Standard Deviation (Population) | 25.9% | 4.8% |
Similar Demographics by Unemployment Among Women with Children Ages 6 to 17 years
Demographics Similar to Immigrants from South Africa by Unemployment Among Women with Children Ages 6 to 17 years
In terms of unemployment among women with children ages 6 to 17 years, the demographic groups most similar to Immigrants from South Africa are Scandinavian (8.6%, a difference of 0.010%), Immigrants from Pakistan (8.6%, a difference of 0.020%), Immigrants from Lithuania (8.6%, a difference of 0.030%), New Zealander (8.6%, a difference of 0.030%), and Malaysian (8.6%, a difference of 0.10%).
| Demographics | Rating | Rank | Unemployment Among Women with Children Ages 6 to 17 years |
| Sri Lankans | 98.7 /100 | #95 | Exceptional 8.5% |
| German Russians | 98.6 /100 | #96 | Exceptional 8.5% |
| Bolivians | 98.5 /100 | #97 | Exceptional 8.5% |
| Malaysians | 98.5 /100 | #98 | Exceptional 8.6% |
| Immigrants | Lithuania | 98.4 /100 | #99 | Exceptional 8.6% |
| New Zealanders | 98.4 /100 | #100 | Exceptional 8.6% |
| Immigrants | Pakistan | 98.4 /100 | #101 | Exceptional 8.6% |
| Immigrants | South Africa | 98.3 /100 | #102 | Exceptional 8.6% |
| Scandinavians | 98.3 /100 | #103 | Exceptional 8.6% |
| Immigrants | France | 98.0 /100 | #104 | Exceptional 8.6% |
| Immigrants | Norway | 97.8 /100 | #105 | Exceptional 8.6% |
| Immigrants | Serbia | 97.7 /100 | #106 | Exceptional 8.6% |
| Chickasaw | 97.6 /100 | #107 | Exceptional 8.6% |
| Swedes | 97.6 /100 | #108 | Exceptional 8.6% |
| Immigrants | Romania | 97.5 /100 | #109 | Exceptional 8.6% |
Demographics Similar to Immigrants from Belarus by Unemployment Among Women with Children Ages 6 to 17 years
In terms of unemployment among women with children ages 6 to 17 years, the demographic groups most similar to Immigrants from Belarus are Mongolian (8.4%, a difference of 0.040%), Pakistani (8.4%, a difference of 0.050%), Immigrants from Bolivia (8.4%, a difference of 0.12%), Cypriot (8.4%, a difference of 0.14%), and Iraqi (8.4%, a difference of 0.18%).
| Demographics | Rating | Rank | Unemployment Among Women with Children Ages 6 to 17 years |
| Spanish Americans | 99.8 /100 | #73 | Exceptional 8.4% |
| Samoans | 99.7 /100 | #74 | Exceptional 8.4% |
| Immigrants | Sri Lanka | 99.7 /100 | #75 | Exceptional 8.4% |
| Immigrants | Moldova | 99.7 /100 | #76 | Exceptional 8.4% |
| Iraqis | 99.7 /100 | #77 | Exceptional 8.4% |
| Pakistanis | 99.6 /100 | #78 | Exceptional 8.4% |
| Mongolians | 99.6 /100 | #79 | Exceptional 8.4% |
| Immigrants | Belarus | 99.6 /100 | #80 | Exceptional 8.4% |
| Immigrants | Bolivia | 99.6 /100 | #81 | Exceptional 8.4% |
| Cypriots | 99.6 /100 | #82 | Exceptional 8.4% |
| Bulgarians | 99.5 /100 | #83 | Exceptional 8.4% |
| Japanese | 99.5 /100 | #84 | Exceptional 8.4% |
| Immigrants | North Macedonia | 99.4 /100 | #85 | Exceptional 8.5% |
| Alaskan Athabascans | 99.4 /100 | #86 | Exceptional 8.5% |
| Immigrants | Israel | 99.1 /100 | #87 | Exceptional 8.5% |