Immigrants from Syria vs English Unemployment Among Women with Children Ages 6 to 17 years
COMPARE
Immigrants from Syria
English
Unemployment Among Women with Children Ages 6 to 17 years
Unemployment Among Women with Children Ages 6 to 17 years Comparison
Immigrants from Syria
English
9.1%
UNEMPLOYMENT AMONG WOMEN WITH CHILDREN AGES 6 TO 17 YEARS
29.7/ 100
METRIC RATING
188th/ 347
METRIC RANK
9.4%
UNEMPLOYMENT AMONG WOMEN WITH CHILDREN AGES 6 TO 17 YEARS
1.9/ 100
METRIC RATING
244th/ 347
METRIC RANK
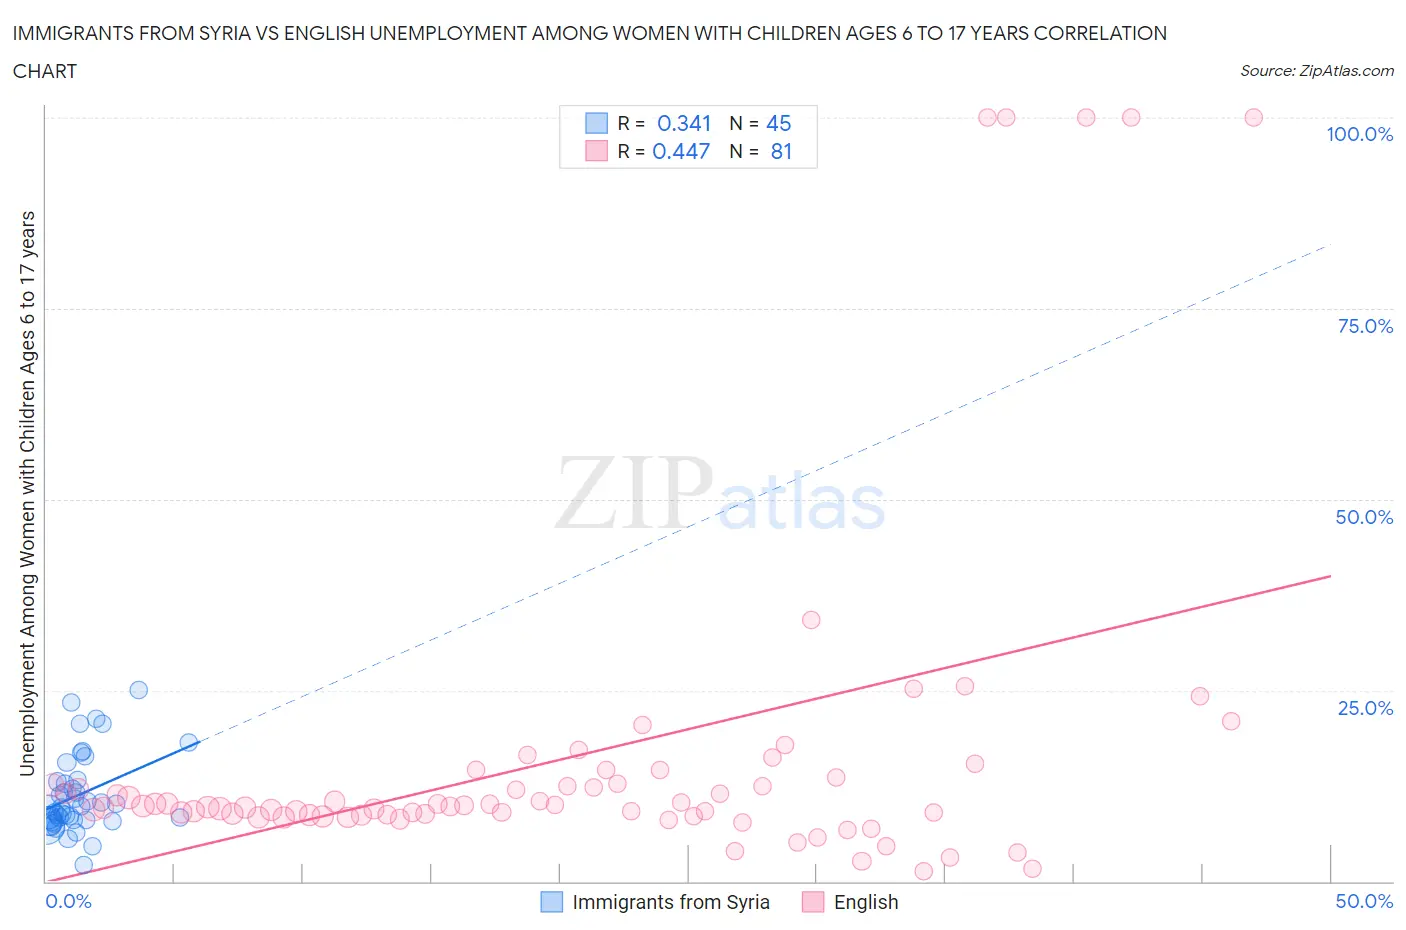
Immigrants from Syria vs English Unemployment Among Women with Children Ages 6 to 17 years Correlation Chart
The statistical analysis conducted on geographies consisting of 145,483,764 people shows a mild positive correlation between the proportion of Immigrants from Syria and unemployment rate among women with children between the ages 6 and 17 in the United States with a correlation coefficient (R) of 0.341 and weighted average of 9.1%. Similarly, the statistical analysis conducted on geographies consisting of 358,817,794 people shows a moderate positive correlation between the proportion of English and unemployment rate among women with children between the ages 6 and 17 in the United States with a correlation coefficient (R) of 0.447 and weighted average of 9.4%, a difference of 3.4%.
Unemployment Among Women with Children Ages 6 to 17 years Correlation Summary
| Measurement | Immigrants from Syria | English |
| Minimum | 2.2% | 1.3% |
| Maximum | 25.1% | 100.0% |
| Range | 22.9% | 98.7% |
| Mean | 11.3% | 16.4% |
| Median | 9.9% | 9.8% |
| Interquartile 25% (IQ1) | 8.0% | 8.6% |
| Interquartile 75% (IQ3) | 13.2% | 13.2% |
| Interquartile Range (IQR) | 5.2% | 4.6% |
| Standard Deviation (Sample) | 5.1% | 22.2% |
| Standard Deviation (Population) | 5.1% | 22.1% |
Similar Demographics by Unemployment Among Women with Children Ages 6 to 17 years
Demographics Similar to Immigrants from Syria by Unemployment Among Women with Children Ages 6 to 17 years
In terms of unemployment among women with children ages 6 to 17 years, the demographic groups most similar to Immigrants from Syria are Comanche (9.0%, a difference of 0.020%), Immigrants (9.1%, a difference of 0.030%), Slovene (9.1%, a difference of 0.070%), Belizean (9.1%, a difference of 0.070%), and Immigrants from Spain (9.0%, a difference of 0.14%).
| Demographics | Rating | Rank | Unemployment Among Women with Children Ages 6 to 17 years |
| Immigrants | Czechoslovakia | 34.5 /100 | #181 | Fair 9.0% |
| South American Indians | 34.4 /100 | #182 | Fair 9.0% |
| Swiss | 33.5 /100 | #183 | Fair 9.0% |
| Palestinians | 33.4 /100 | #184 | Fair 9.0% |
| Immigrants | Congo | 32.5 /100 | #185 | Fair 9.0% |
| Immigrants | Spain | 32.4 /100 | #186 | Fair 9.0% |
| Comanche | 30.0 /100 | #187 | Fair 9.0% |
| Immigrants | Syria | 29.7 /100 | #188 | Fair 9.1% |
| Immigrants | Immigrants | 29.2 /100 | #189 | Fair 9.1% |
| Slovenes | 28.5 /100 | #190 | Fair 9.1% |
| Belizeans | 28.4 /100 | #191 | Fair 9.1% |
| Guamanians/Chamorros | 27.2 /100 | #192 | Fair 9.1% |
| Immigrants | Turkey | 25.8 /100 | #193 | Fair 9.1% |
| Immigrants | Kazakhstan | 25.3 /100 | #194 | Fair 9.1% |
| Austrians | 25.0 /100 | #195 | Fair 9.1% |
Demographics Similar to English by Unemployment Among Women with Children Ages 6 to 17 years
In terms of unemployment among women with children ages 6 to 17 years, the demographic groups most similar to English are Immigrants from Cameroon (9.4%, a difference of 0.030%), Scottish (9.4%, a difference of 0.050%), Immigrants from Colombia (9.3%, a difference of 0.14%), Colombian (9.3%, a difference of 0.16%), and Immigrants from Africa (9.4%, a difference of 0.20%).
| Demographics | Rating | Rank | Unemployment Among Women with Children Ages 6 to 17 years |
| Immigrants | Belize | 2.8 /100 | #237 | Tragic 9.3% |
| Arabs | 2.7 /100 | #238 | Tragic 9.3% |
| Immigrants | Saudi Arabia | 2.7 /100 | #239 | Tragic 9.3% |
| Guatemalans | 2.3 /100 | #240 | Tragic 9.3% |
| Colombians | 2.2 /100 | #241 | Tragic 9.3% |
| Immigrants | Colombia | 2.1 /100 | #242 | Tragic 9.3% |
| Scottish | 2.0 /100 | #243 | Tragic 9.4% |
| English | 1.9 /100 | #244 | Tragic 9.4% |
| Immigrants | Cameroon | 1.8 /100 | #245 | Tragic 9.4% |
| Immigrants | Africa | 1.6 /100 | #246 | Tragic 9.4% |
| Poles | 1.5 /100 | #247 | Tragic 9.4% |
| Dutch | 1.5 /100 | #248 | Tragic 9.4% |
| Immigrants | South America | 1.5 /100 | #249 | Tragic 9.4% |
| Immigrants | Guatemala | 1.3 /100 | #250 | Tragic 9.4% |
| Central Americans | 1.3 /100 | #251 | Tragic 9.4% |