Immigrants from the Azores vs English Unemployment Among Women with Children Ages 6 to 17 years
COMPARE
Immigrants from the Azores
English
Unemployment Among Women with Children Ages 6 to 17 years
Unemployment Among Women with Children Ages 6 to 17 years Comparison
Immigrants from the Azores
English
9.3%
UNEMPLOYMENT AMONG WOMEN WITH CHILDREN AGES 6 TO 17 YEARS
4.6/ 100
METRIC RATING
226th/ 347
METRIC RANK
9.4%
UNEMPLOYMENT AMONG WOMEN WITH CHILDREN AGES 6 TO 17 YEARS
1.9/ 100
METRIC RATING
244th/ 347
METRIC RANK
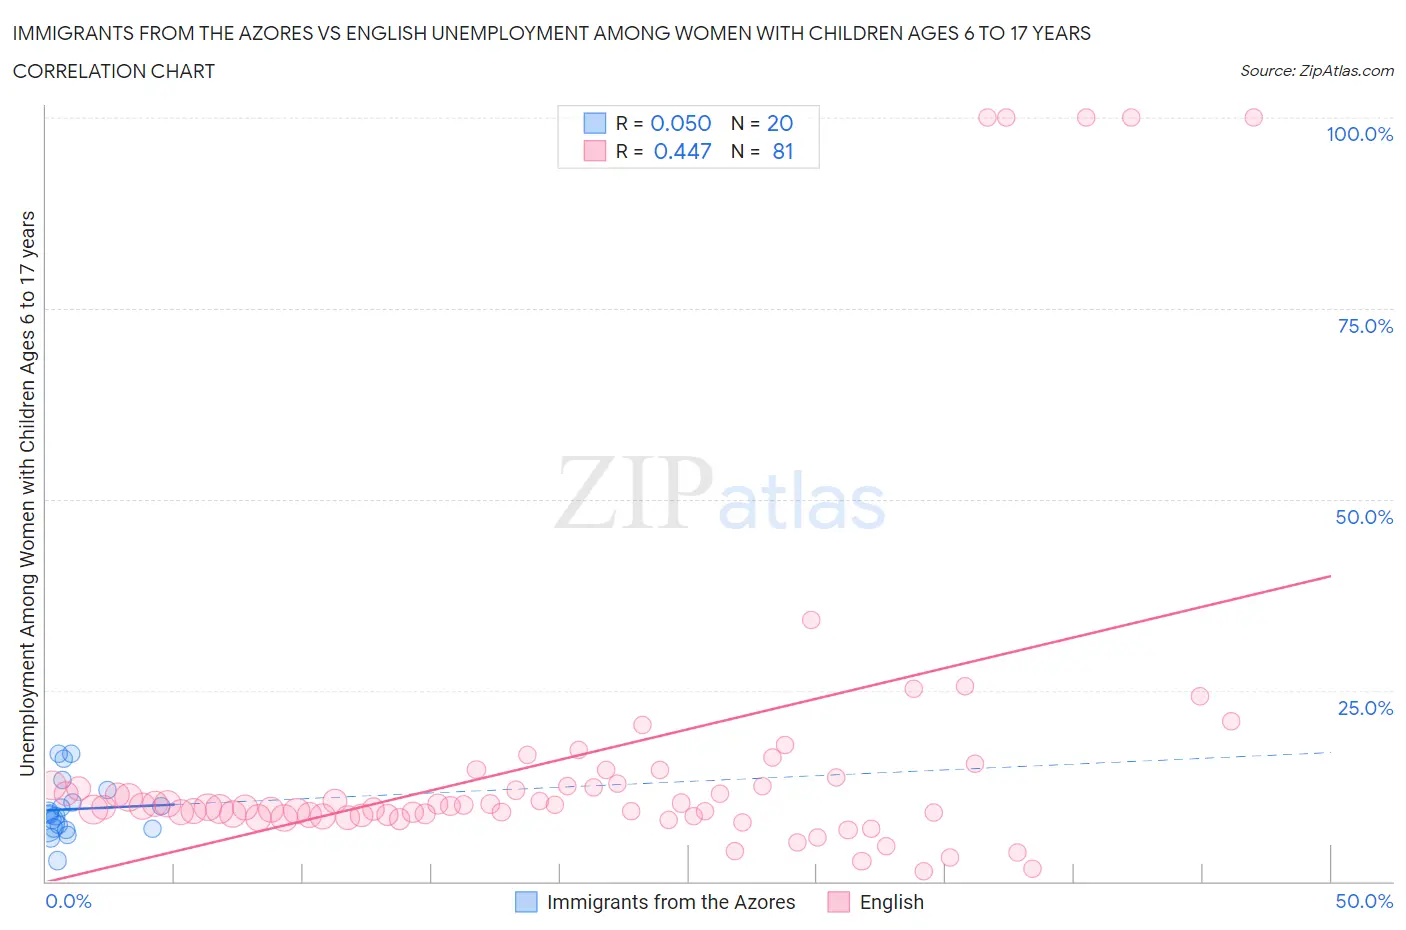
Immigrants from the Azores vs English Unemployment Among Women with Children Ages 6 to 17 years Correlation Chart
The statistical analysis conducted on geographies consisting of 39,080,392 people shows no correlation between the proportion of Immigrants from the Azores and unemployment rate among women with children between the ages 6 and 17 in the United States with a correlation coefficient (R) of 0.050 and weighted average of 9.3%. Similarly, the statistical analysis conducted on geographies consisting of 358,817,794 people shows a moderate positive correlation between the proportion of English and unemployment rate among women with children between the ages 6 and 17 in the United States with a correlation coefficient (R) of 0.447 and weighted average of 9.4%, a difference of 0.99%.
Unemployment Among Women with Children Ages 6 to 17 years Correlation Summary
| Measurement | Immigrants from the Azores | English |
| Minimum | 2.7% | 1.3% |
| Maximum | 16.7% | 100.0% |
| Range | 14.0% | 98.7% |
| Mean | 9.4% | 16.4% |
| Median | 8.6% | 9.8% |
| Interquartile 25% (IQ1) | 6.9% | 8.6% |
| Interquartile 75% (IQ3) | 11.1% | 13.2% |
| Interquartile Range (IQR) | 4.2% | 4.6% |
| Standard Deviation (Sample) | 3.8% | 22.2% |
| Standard Deviation (Population) | 3.7% | 22.1% |
Demographics Similar to Immigrants from the Azores and English by Unemployment Among Women with Children Ages 6 to 17 years
In terms of unemployment among women with children ages 6 to 17 years, the demographic groups most similar to Immigrants from the Azores are Panamanian (9.3%, a difference of 0.020%), Estonian (9.3%, a difference of 0.050%), Lumbee (9.3%, a difference of 0.080%), Chinese (9.3%, a difference of 0.14%), and Welsh (9.3%, a difference of 0.17%). Similarly, the demographic groups most similar to English are Immigrants from Cameroon (9.4%, a difference of 0.030%), Scottish (9.4%, a difference of 0.050%), Immigrants from Colombia (9.3%, a difference of 0.14%), Colombian (9.3%, a difference of 0.16%), and Guatemalan (9.3%, a difference of 0.23%).
| Demographics | Rating | Rank | Unemployment Among Women with Children Ages 6 to 17 years |
| Chinese | 5.2 /100 | #225 | Tragic 9.3% |
| Immigrants | Azores | 4.6 /100 | #226 | Tragic 9.3% |
| Panamanians | 4.5 /100 | #227 | Tragic 9.3% |
| Estonians | 4.4 /100 | #228 | Tragic 9.3% |
| Lumbee | 4.3 /100 | #229 | Tragic 9.3% |
| Welsh | 4.0 /100 | #230 | Tragic 9.3% |
| Macedonians | 3.9 /100 | #231 | Tragic 9.3% |
| French American Indians | 3.7 /100 | #232 | Tragic 9.3% |
| Immigrants | St. Vincent and the Grenadines | 3.3 /100 | #233 | Tragic 9.3% |
| Mexicans | 3.2 /100 | #234 | Tragic 9.3% |
| Uruguayans | 3.0 /100 | #235 | Tragic 9.3% |
| Hungarians | 3.0 /100 | #236 | Tragic 9.3% |
| Immigrants | Belize | 2.8 /100 | #237 | Tragic 9.3% |
| Arabs | 2.7 /100 | #238 | Tragic 9.3% |
| Immigrants | Saudi Arabia | 2.7 /100 | #239 | Tragic 9.3% |
| Guatemalans | 2.3 /100 | #240 | Tragic 9.3% |
| Colombians | 2.2 /100 | #241 | Tragic 9.3% |
| Immigrants | Colombia | 2.1 /100 | #242 | Tragic 9.3% |
| Scottish | 2.0 /100 | #243 | Tragic 9.4% |
| English | 1.9 /100 | #244 | Tragic 9.4% |
| Immigrants | Cameroon | 1.8 /100 | #245 | Tragic 9.4% |