Immigrants from Oceania vs Asian Unemployment
COMPARE
Immigrants from Oceania
Asian
Unemployment
Unemployment Comparison
Immigrants from Oceania
Asians
5.2%
UNEMPLOYMENT
65.2/ 100
METRIC RATING
161st/ 347
METRIC RANK
5.1%
UNEMPLOYMENT
89.0/ 100
METRIC RATING
123rd/ 347
METRIC RANK
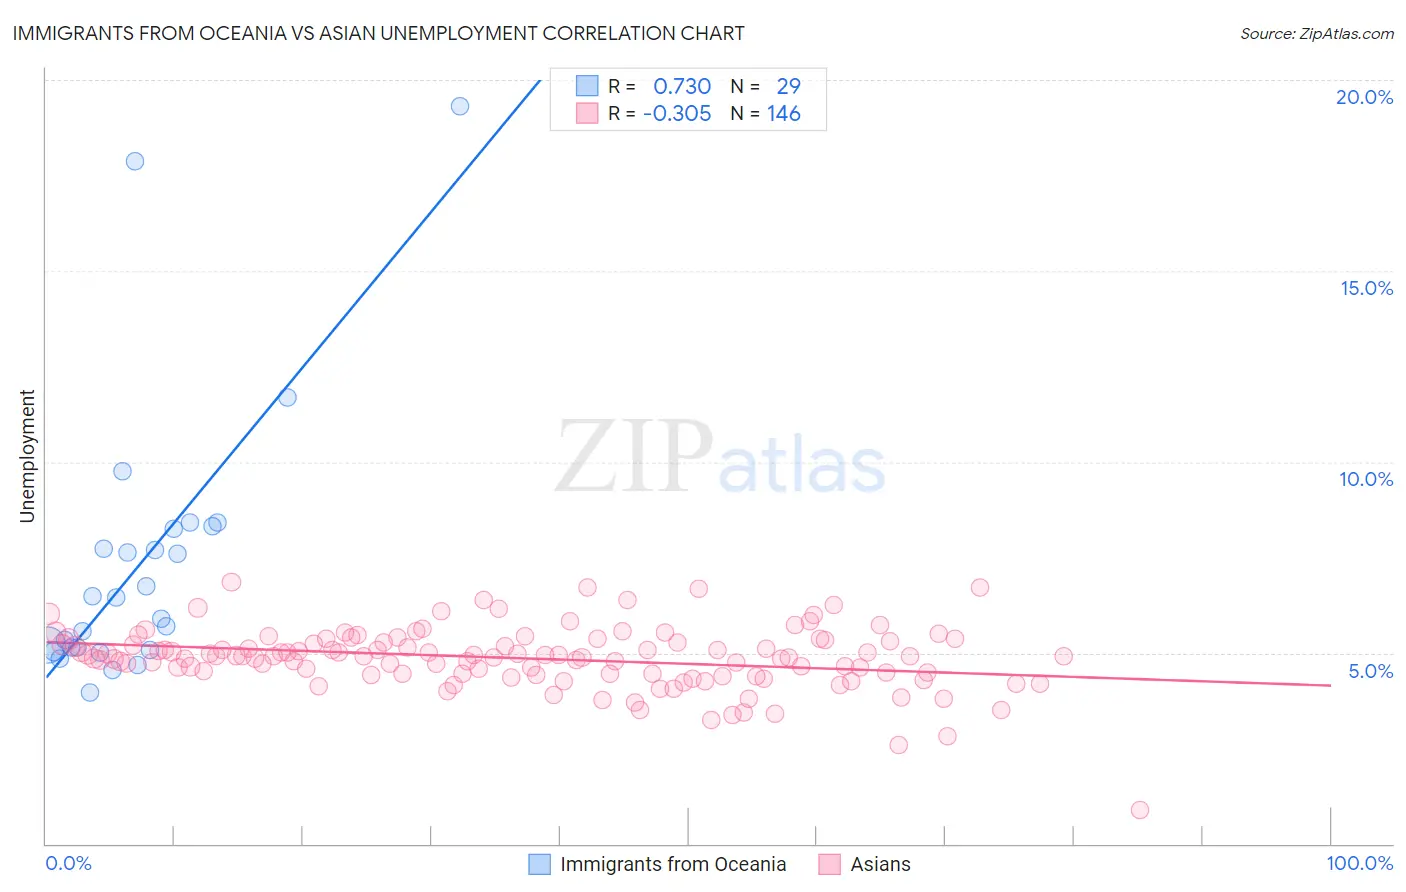
Immigrants from Oceania vs Asian Unemployment Correlation Chart
The statistical analysis conducted on geographies consisting of 305,291,024 people shows a strong positive correlation between the proportion of Immigrants from Oceania and unemployment in the United States with a correlation coefficient (R) of 0.730 and weighted average of 5.2%. Similarly, the statistical analysis conducted on geographies consisting of 548,726,381 people shows a mild negative correlation between the proportion of Asians and unemployment in the United States with a correlation coefficient (R) of -0.305 and weighted average of 5.1%, a difference of 2.3%.
Unemployment Correlation Summary
| Measurement | Immigrants from Oceania | Asian |
| Minimum | 4.0% | 0.90% |
| Maximum | 19.3% | 6.9% |
| Range | 15.3% | 6.0% |
| Mean | 7.4% | 4.9% |
| Median | 6.4% | 4.9% |
| Interquartile 25% (IQ1) | 5.1% | 4.5% |
| Interquartile 75% (IQ3) | 8.3% | 5.3% |
| Interquartile Range (IQR) | 3.2% | 0.84% |
| Standard Deviation (Sample) | 3.6% | 0.81% |
| Standard Deviation (Population) | 3.5% | 0.81% |
Similar Demographics by Unemployment
Demographics Similar to Immigrants from Oceania by Unemployment
In terms of unemployment, the demographic groups most similar to Immigrants from Oceania are Spanish (5.2%, a difference of 0.010%), Immigrants from Zaire (5.2%, a difference of 0.030%), Immigrants from Colombia (5.2%, a difference of 0.040%), Laotian (5.2%, a difference of 0.080%), and Immigrants from Egypt (5.2%, a difference of 0.10%).
| Demographics | Rating | Rank | Unemployment |
| Immigrants | China | 74.7 /100 | #154 | Good 5.2% |
| Immigrants | Northern Africa | 71.3 /100 | #155 | Good 5.2% |
| Immigrants | Kazakhstan | 70.4 /100 | #156 | Good 5.2% |
| Sri Lankans | 69.5 /100 | #157 | Good 5.2% |
| Immigrants | Egypt | 66.7 /100 | #158 | Good 5.2% |
| Immigrants | Russia | 66.6 /100 | #159 | Good 5.2% |
| Laotians | 66.3 /100 | #160 | Good 5.2% |
| Immigrants | Oceania | 65.2 /100 | #161 | Good 5.2% |
| Spanish | 65.1 /100 | #162 | Good 5.2% |
| Immigrants | Zaire | 64.7 /100 | #163 | Good 5.2% |
| Immigrants | Colombia | 64.7 /100 | #164 | Good 5.2% |
| Immigrants | Brazil | 63.1 /100 | #165 | Good 5.2% |
| Immigrants | Indonesia | 61.2 /100 | #166 | Good 5.2% |
| Colombians | 61.1 /100 | #167 | Good 5.2% |
| Uruguayans | 60.2 /100 | #168 | Good 5.2% |
Demographics Similar to Asians by Unemployment
In terms of unemployment, the demographic groups most similar to Asians are Immigrants from Switzerland (5.1%, a difference of 0.020%), Lebanese (5.1%, a difference of 0.040%), Ethiopian (5.1%, a difference of 0.050%), Immigrants from Eastern Asia (5.1%, a difference of 0.10%), and Macedonian (5.1%, a difference of 0.11%).
| Demographics | Rating | Rank | Unemployment |
| Immigrants | Sri Lanka | 91.1 /100 | #116 | Exceptional 5.1% |
| Immigrants | Malaysia | 91.0 /100 | #117 | Exceptional 5.1% |
| Immigrants | Germany | 90.8 /100 | #118 | Exceptional 5.1% |
| Immigrants | France | 89.7 /100 | #119 | Excellent 5.1% |
| Macedonians | 89.7 /100 | #120 | Excellent 5.1% |
| Lebanese | 89.2 /100 | #121 | Excellent 5.1% |
| Immigrants | Switzerland | 89.1 /100 | #122 | Excellent 5.1% |
| Asians | 89.0 /100 | #123 | Excellent 5.1% |
| Ethiopians | 88.6 /100 | #124 | Excellent 5.1% |
| Immigrants | Eastern Asia | 88.3 /100 | #125 | Excellent 5.1% |
| Kenyans | 88.2 /100 | #126 | Excellent 5.1% |
| Immigrants | Kenya | 88.2 /100 | #127 | Excellent 5.1% |
| Immigrants | Eastern Africa | 88.1 /100 | #128 | Excellent 5.1% |
| Immigrants | Latvia | 88.0 /100 | #129 | Excellent 5.1% |
| Iranians | 86.9 /100 | #130 | Excellent 5.1% |