Immigrants from Oceania vs Jamaican Unemployment
COMPARE
Immigrants from Oceania
Jamaican
Unemployment
Unemployment Comparison
Immigrants from Oceania
Jamaicans
5.2%
UNEMPLOYMENT
65.2/ 100
METRIC RATING
161st/ 347
METRIC RANK
6.3%
UNEMPLOYMENT
0.0/ 100
METRIC RATING
297th/ 347
METRIC RANK
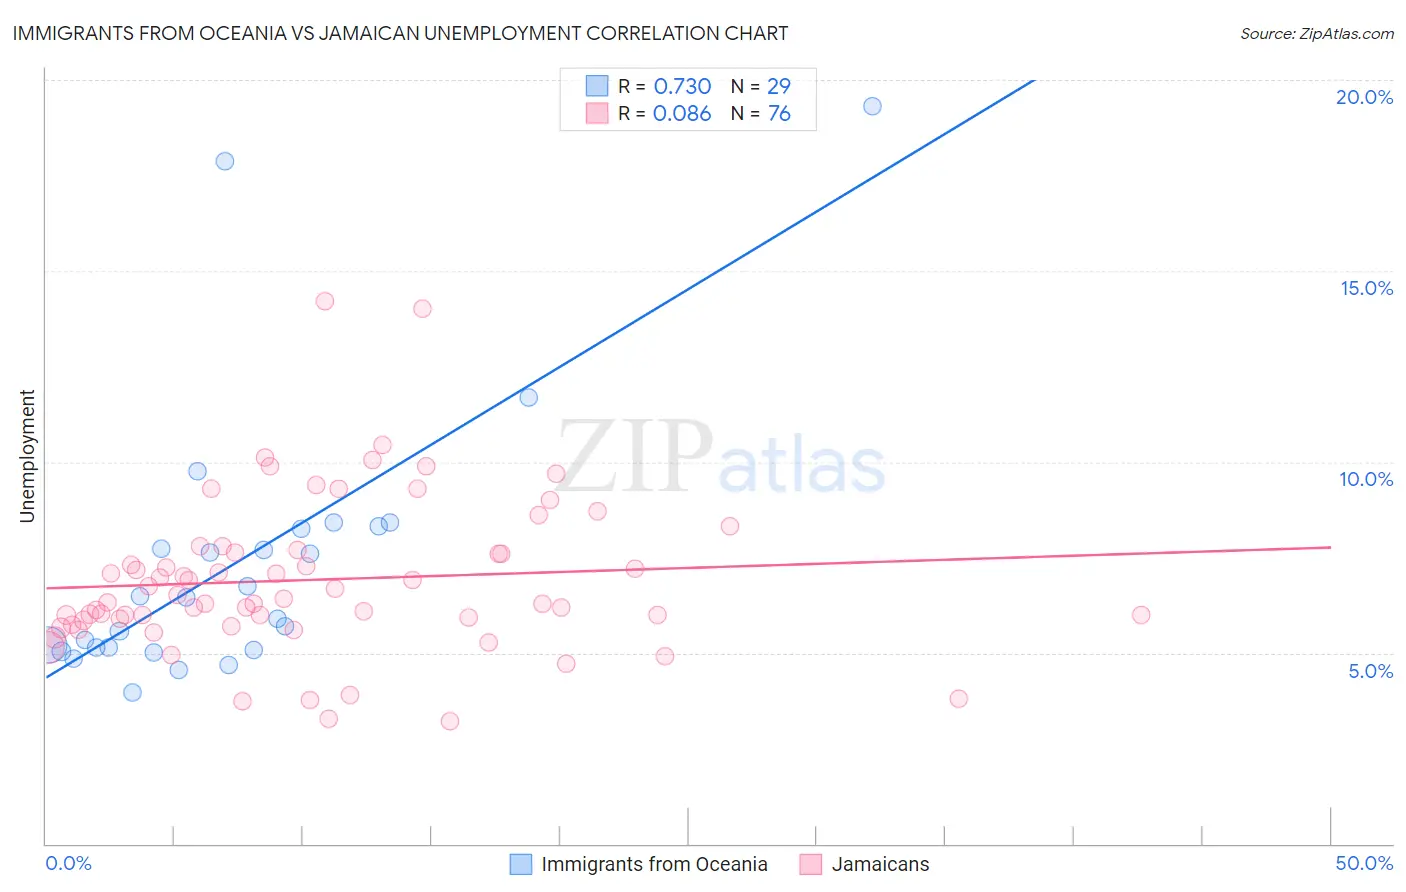
Immigrants from Oceania vs Jamaican Unemployment Correlation Chart
The statistical analysis conducted on geographies consisting of 305,291,024 people shows a strong positive correlation between the proportion of Immigrants from Oceania and unemployment in the United States with a correlation coefficient (R) of 0.730 and weighted average of 5.2%. Similarly, the statistical analysis conducted on geographies consisting of 367,761,379 people shows a slight positive correlation between the proportion of Jamaicans and unemployment in the United States with a correlation coefficient (R) of 0.086 and weighted average of 6.3%, a difference of 21.0%.
Unemployment Correlation Summary
| Measurement | Immigrants from Oceania | Jamaican |
| Minimum | 4.0% | 3.2% |
| Maximum | 19.3% | 14.2% |
| Range | 15.3% | 11.0% |
| Mean | 7.4% | 6.9% |
| Median | 6.4% | 6.4% |
| Interquartile 25% (IQ1) | 5.1% | 5.9% |
| Interquartile 75% (IQ3) | 8.3% | 7.7% |
| Interquartile Range (IQR) | 3.2% | 1.8% |
| Standard Deviation (Sample) | 3.6% | 2.0% |
| Standard Deviation (Population) | 3.5% | 2.0% |
Similar Demographics by Unemployment
Demographics Similar to Immigrants from Oceania by Unemployment
In terms of unemployment, the demographic groups most similar to Immigrants from Oceania are Spanish (5.2%, a difference of 0.010%), Immigrants from Zaire (5.2%, a difference of 0.030%), Immigrants from Colombia (5.2%, a difference of 0.040%), Laotian (5.2%, a difference of 0.080%), and Immigrants from Egypt (5.2%, a difference of 0.10%).
| Demographics | Rating | Rank | Unemployment |
| Immigrants | China | 74.7 /100 | #154 | Good 5.2% |
| Immigrants | Northern Africa | 71.3 /100 | #155 | Good 5.2% |
| Immigrants | Kazakhstan | 70.4 /100 | #156 | Good 5.2% |
| Sri Lankans | 69.5 /100 | #157 | Good 5.2% |
| Immigrants | Egypt | 66.7 /100 | #158 | Good 5.2% |
| Immigrants | Russia | 66.6 /100 | #159 | Good 5.2% |
| Laotians | 66.3 /100 | #160 | Good 5.2% |
| Immigrants | Oceania | 65.2 /100 | #161 | Good 5.2% |
| Spanish | 65.1 /100 | #162 | Good 5.2% |
| Immigrants | Zaire | 64.7 /100 | #163 | Good 5.2% |
| Immigrants | Colombia | 64.7 /100 | #164 | Good 5.2% |
| Immigrants | Brazil | 63.1 /100 | #165 | Good 5.2% |
| Immigrants | Indonesia | 61.2 /100 | #166 | Good 5.2% |
| Colombians | 61.1 /100 | #167 | Good 5.2% |
| Uruguayans | 60.2 /100 | #168 | Good 5.2% |
Demographics Similar to Jamaicans by Unemployment
In terms of unemployment, the demographic groups most similar to Jamaicans are Immigrants from Haiti (6.3%, a difference of 0.090%), Immigrants from West Indies (6.3%, a difference of 0.14%), Immigrants from Trinidad and Tobago (6.3%, a difference of 0.26%), Ute (6.3%, a difference of 0.34%), and Trinidadian and Tobagonian (6.3%, a difference of 0.74%).
| Demographics | Rating | Rank | Unemployment |
| Senegalese | 0.0 /100 | #290 | Tragic 6.2% |
| Haitians | 0.0 /100 | #291 | Tragic 6.2% |
| Central American Indians | 0.0 /100 | #292 | Tragic 6.2% |
| Immigrants | Ecuador | 0.0 /100 | #293 | Tragic 6.2% |
| Spanish American Indians | 0.0 /100 | #294 | Tragic 6.2% |
| U.S. Virgin Islanders | 0.0 /100 | #295 | Tragic 6.3% |
| Ute | 0.0 /100 | #296 | Tragic 6.3% |
| Jamaicans | 0.0 /100 | #297 | Tragic 6.3% |
| Immigrants | Haiti | 0.0 /100 | #298 | Tragic 6.3% |
| Immigrants | West Indies | 0.0 /100 | #299 | Tragic 6.3% |
| Immigrants | Trinidad and Tobago | 0.0 /100 | #300 | Tragic 6.3% |
| Trinidadians and Tobagonians | 0.0 /100 | #301 | Tragic 6.3% |
| West Indians | 0.0 /100 | #302 | Tragic 6.4% |
| Belizeans | 0.0 /100 | #303 | Tragic 6.4% |
| Immigrants | Jamaica | 0.0 /100 | #304 | Tragic 6.4% |