Immigrants from North Macedonia vs West Indian Unemployment
COMPARE
Immigrants from North Macedonia
West Indian
Unemployment
Unemployment Comparison
Immigrants from North Macedonia
West Indians
5.0%
UNEMPLOYMENT
96.3/ 100
METRIC RATING
90th/ 347
METRIC RANK
6.4%
UNEMPLOYMENT
0.0/ 100
METRIC RATING
302nd/ 347
METRIC RANK
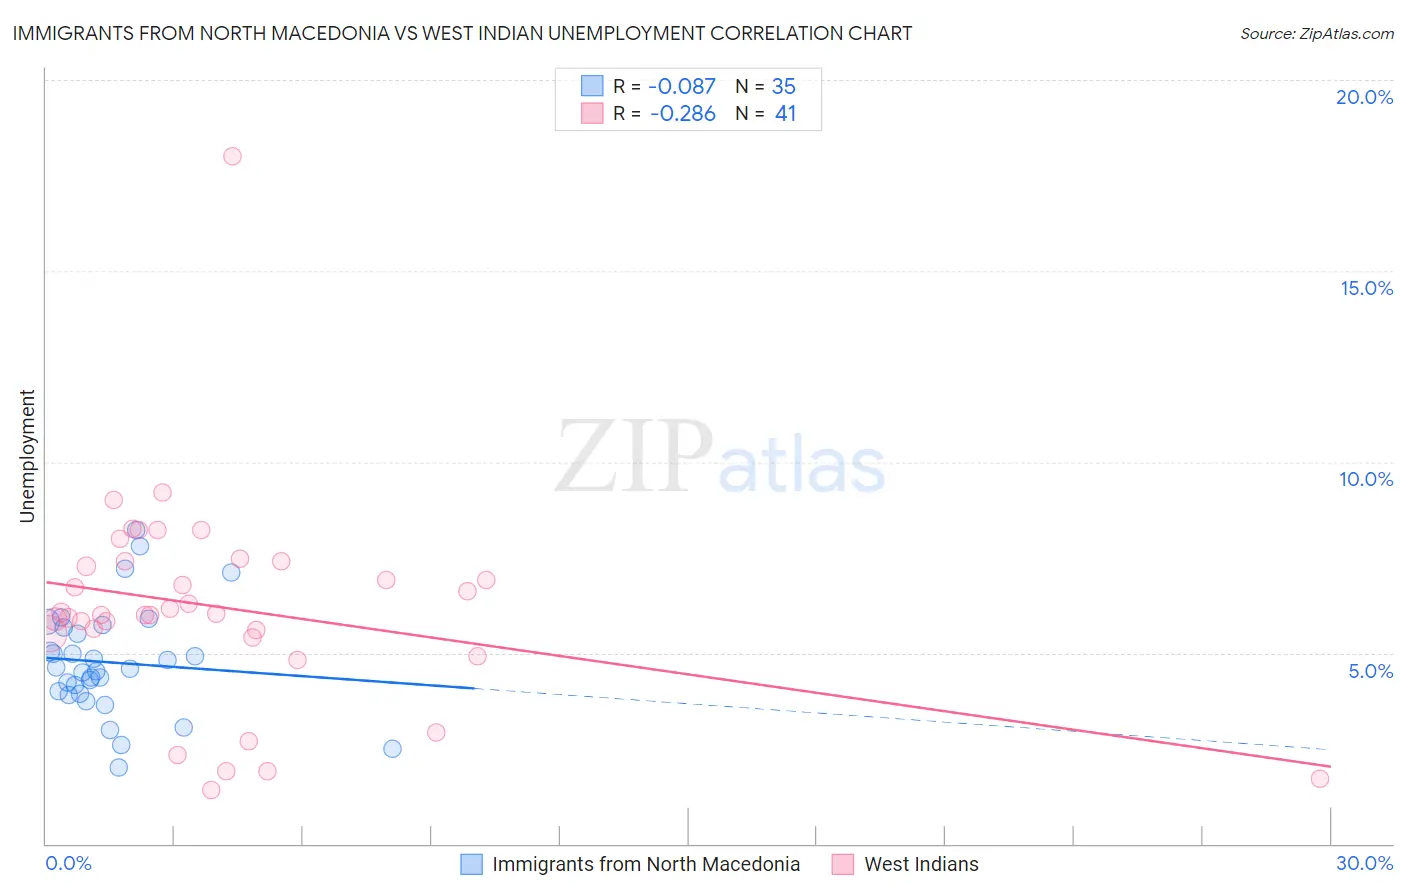
Immigrants from North Macedonia vs West Indian Unemployment Correlation Chart
The statistical analysis conducted on geographies consisting of 74,281,538 people shows a slight negative correlation between the proportion of Immigrants from North Macedonia and unemployment in the United States with a correlation coefficient (R) of -0.087 and weighted average of 5.0%. Similarly, the statistical analysis conducted on geographies consisting of 253,931,016 people shows a weak negative correlation between the proportion of West Indians and unemployment in the United States with a correlation coefficient (R) of -0.286 and weighted average of 6.4%, a difference of 27.4%.
Unemployment Correlation Summary
| Measurement | Immigrants from North Macedonia | West Indian |
| Minimum | 2.0% | 1.4% |
| Maximum | 8.2% | 18.0% |
| Range | 6.2% | 16.6% |
| Mean | 4.7% | 6.2% |
| Median | 4.6% | 6.0% |
| Interquartile 25% (IQ1) | 3.9% | 5.5% |
| Interquartile 75% (IQ3) | 5.7% | 7.4% |
| Interquartile Range (IQR) | 1.8% | 1.9% |
| Standard Deviation (Sample) | 1.4% | 2.8% |
| Standard Deviation (Population) | 1.4% | 2.7% |
Similar Demographics by Unemployment
Demographics Similar to Immigrants from North Macedonia by Unemployment
In terms of unemployment, the demographic groups most similar to Immigrants from North Macedonia are Immigrants from Sudan (5.0%, a difference of 0.010%), Immigrants from South Africa (5.0%, a difference of 0.030%), Jordanian (5.0%, a difference of 0.040%), Ukrainian (5.0%, a difference of 0.12%), and Immigrants from Korea (5.0%, a difference of 0.13%).
| Demographics | Rating | Rank | Unemployment |
| Hmong | 97.6 /100 | #83 | Exceptional 5.0% |
| Russians | 97.4 /100 | #84 | Exceptional 5.0% |
| Immigrants | Australia | 97.0 /100 | #85 | Exceptional 5.0% |
| Hungarians | 96.9 /100 | #86 | Exceptional 5.0% |
| Immigrants | Moldova | 96.6 /100 | #87 | Exceptional 5.0% |
| Immigrants | Korea | 96.6 /100 | #88 | Exceptional 5.0% |
| Jordanians | 96.4 /100 | #89 | Exceptional 5.0% |
| Immigrants | North Macedonia | 96.3 /100 | #90 | Exceptional 5.0% |
| Immigrants | Sudan | 96.3 /100 | #91 | Exceptional 5.0% |
| Immigrants | South Africa | 96.2 /100 | #92 | Exceptional 5.0% |
| Ukrainians | 96.0 /100 | #93 | Exceptional 5.0% |
| Immigrants | Austria | 95.9 /100 | #94 | Exceptional 5.0% |
| Immigrants | Serbia | 95.6 /100 | #95 | Exceptional 5.0% |
| Immigrants | England | 95.2 /100 | #96 | Exceptional 5.0% |
| Immigrants | Czechoslovakia | 95.1 /100 | #97 | Exceptional 5.0% |
Demographics Similar to West Indians by Unemployment
In terms of unemployment, the demographic groups most similar to West Indians are Belizean (6.4%, a difference of 0.23%), Trinidadian and Tobagonian (6.3%, a difference of 0.25%), Immigrants from Trinidad and Tobago (6.3%, a difference of 0.74%), Immigrants from West Indies (6.3%, a difference of 0.86%), and Immigrants from Haiti (6.3%, a difference of 0.90%).
| Demographics | Rating | Rank | Unemployment |
| U.S. Virgin Islanders | 0.0 /100 | #295 | Tragic 6.3% |
| Ute | 0.0 /100 | #296 | Tragic 6.3% |
| Jamaicans | 0.0 /100 | #297 | Tragic 6.3% |
| Immigrants | Haiti | 0.0 /100 | #298 | Tragic 6.3% |
| Immigrants | West Indies | 0.0 /100 | #299 | Tragic 6.3% |
| Immigrants | Trinidad and Tobago | 0.0 /100 | #300 | Tragic 6.3% |
| Trinidadians and Tobagonians | 0.0 /100 | #301 | Tragic 6.3% |
| West Indians | 0.0 /100 | #302 | Tragic 6.4% |
| Belizeans | 0.0 /100 | #303 | Tragic 6.4% |
| Immigrants | Jamaica | 0.0 /100 | #304 | Tragic 6.4% |
| Menominee | 0.0 /100 | #305 | Tragic 6.4% |
| Lumbee | 0.0 /100 | #306 | Tragic 6.4% |
| Immigrants | Bangladesh | 0.0 /100 | #307 | Tragic 6.5% |
| Barbadians | 0.0 /100 | #308 | Tragic 6.5% |
| Vietnamese | 0.0 /100 | #309 | Tragic 6.5% |