Estonian vs West Indian Unemployment
COMPARE
Estonian
West Indian
Unemployment
Unemployment Comparison
Estonians
West Indians
5.0%
UNEMPLOYMENT
94.6/ 100
METRIC RATING
100th/ 347
METRIC RANK
6.4%
UNEMPLOYMENT
0.0/ 100
METRIC RATING
302nd/ 347
METRIC RANK
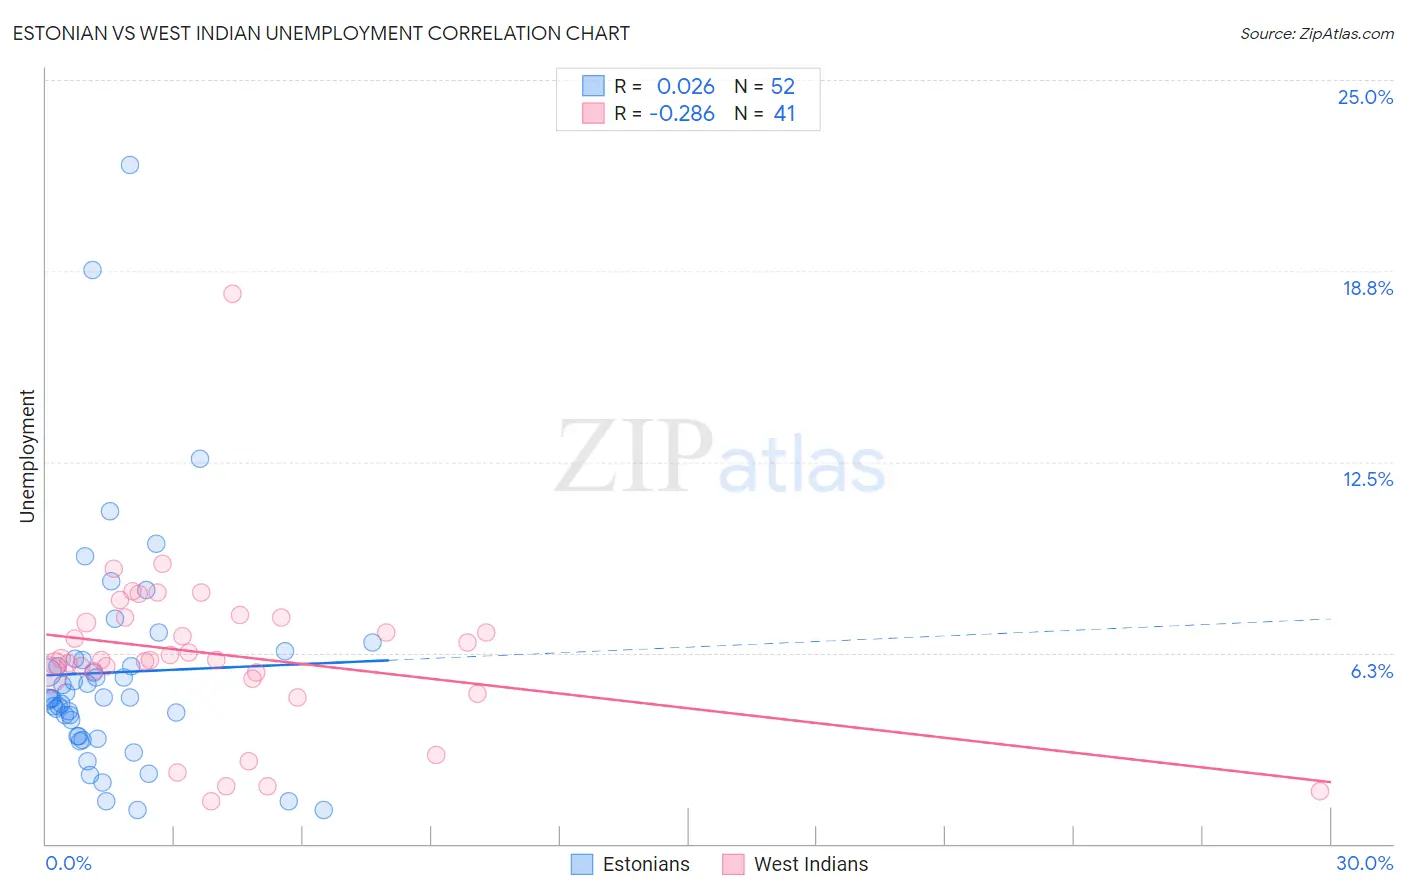
Estonian vs West Indian Unemployment Correlation Chart
The statistical analysis conducted on geographies consisting of 123,457,467 people shows no correlation between the proportion of Estonians and unemployment in the United States with a correlation coefficient (R) of 0.026 and weighted average of 5.0%. Similarly, the statistical analysis conducted on geographies consisting of 253,931,016 people shows a weak negative correlation between the proportion of West Indians and unemployment in the United States with a correlation coefficient (R) of -0.286 and weighted average of 6.4%, a difference of 26.6%.
Unemployment Correlation Summary
| Measurement | Estonian | West Indian |
| Minimum | 1.1% | 1.4% |
| Maximum | 22.2% | 18.0% |
| Range | 21.1% | 16.6% |
| Mean | 5.6% | 6.2% |
| Median | 4.8% | 6.0% |
| Interquartile 25% (IQ1) | 3.5% | 5.5% |
| Interquartile 75% (IQ3) | 6.0% | 7.4% |
| Interquartile Range (IQR) | 2.5% | 1.9% |
| Standard Deviation (Sample) | 3.8% | 2.8% |
| Standard Deviation (Population) | 3.8% | 2.7% |
Similar Demographics by Unemployment
Demographics Similar to Estonians by Unemployment
In terms of unemployment, the demographic groups most similar to Estonians are Mongolian (5.0%, a difference of 0.060%), American (5.0%, a difference of 0.10%), Romanian (5.0%, a difference of 0.13%), Immigrants from Argentina (5.0%, a difference of 0.14%), and Immigrants from Czechoslovakia (5.0%, a difference of 0.16%).
| Demographics | Rating | Rank | Unemployment |
| Ukrainians | 96.0 /100 | #93 | Exceptional 5.0% |
| Immigrants | Austria | 95.9 /100 | #94 | Exceptional 5.0% |
| Immigrants | Serbia | 95.6 /100 | #95 | Exceptional 5.0% |
| Immigrants | England | 95.2 /100 | #96 | Exceptional 5.0% |
| Immigrants | Czechoslovakia | 95.1 /100 | #97 | Exceptional 5.0% |
| Romanians | 95.0 /100 | #98 | Exceptional 5.0% |
| Mongolians | 94.8 /100 | #99 | Exceptional 5.0% |
| Estonians | 94.6 /100 | #100 | Exceptional 5.0% |
| Americans | 94.3 /100 | #101 | Exceptional 5.0% |
| Immigrants | Argentina | 94.1 /100 | #102 | Exceptional 5.0% |
| Chickasaw | 94.0 /100 | #103 | Exceptional 5.0% |
| Osage | 94.0 /100 | #104 | Exceptional 5.0% |
| Maltese | 94.0 /100 | #105 | Exceptional 5.0% |
| Immigrants | Romania | 93.7 /100 | #106 | Exceptional 5.0% |
| Immigrants | Turkey | 93.7 /100 | #107 | Exceptional 5.0% |
Demographics Similar to West Indians by Unemployment
In terms of unemployment, the demographic groups most similar to West Indians are Belizean (6.4%, a difference of 0.23%), Trinidadian and Tobagonian (6.3%, a difference of 0.25%), Immigrants from Trinidad and Tobago (6.3%, a difference of 0.74%), Immigrants from West Indies (6.3%, a difference of 0.86%), and Immigrants from Haiti (6.3%, a difference of 0.90%).
| Demographics | Rating | Rank | Unemployment |
| U.S. Virgin Islanders | 0.0 /100 | #295 | Tragic 6.3% |
| Ute | 0.0 /100 | #296 | Tragic 6.3% |
| Jamaicans | 0.0 /100 | #297 | Tragic 6.3% |
| Immigrants | Haiti | 0.0 /100 | #298 | Tragic 6.3% |
| Immigrants | West Indies | 0.0 /100 | #299 | Tragic 6.3% |
| Immigrants | Trinidad and Tobago | 0.0 /100 | #300 | Tragic 6.3% |
| Trinidadians and Tobagonians | 0.0 /100 | #301 | Tragic 6.3% |
| West Indians | 0.0 /100 | #302 | Tragic 6.4% |
| Belizeans | 0.0 /100 | #303 | Tragic 6.4% |
| Immigrants | Jamaica | 0.0 /100 | #304 | Tragic 6.4% |
| Menominee | 0.0 /100 | #305 | Tragic 6.4% |
| Lumbee | 0.0 /100 | #306 | Tragic 6.4% |
| Immigrants | Bangladesh | 0.0 /100 | #307 | Tragic 6.5% |
| Barbadians | 0.0 /100 | #308 | Tragic 6.5% |
| Vietnamese | 0.0 /100 | #309 | Tragic 6.5% |