Immigrants from Ghana vs West Indian Unemployment
COMPARE
Immigrants from Ghana
West Indian
Unemployment
Unemployment Comparison
Immigrants from Ghana
West Indians
6.1%
UNEMPLOYMENT
0.0/ 100
METRIC RATING
283rd/ 347
METRIC RANK
6.4%
UNEMPLOYMENT
0.0/ 100
METRIC RATING
302nd/ 347
METRIC RANK
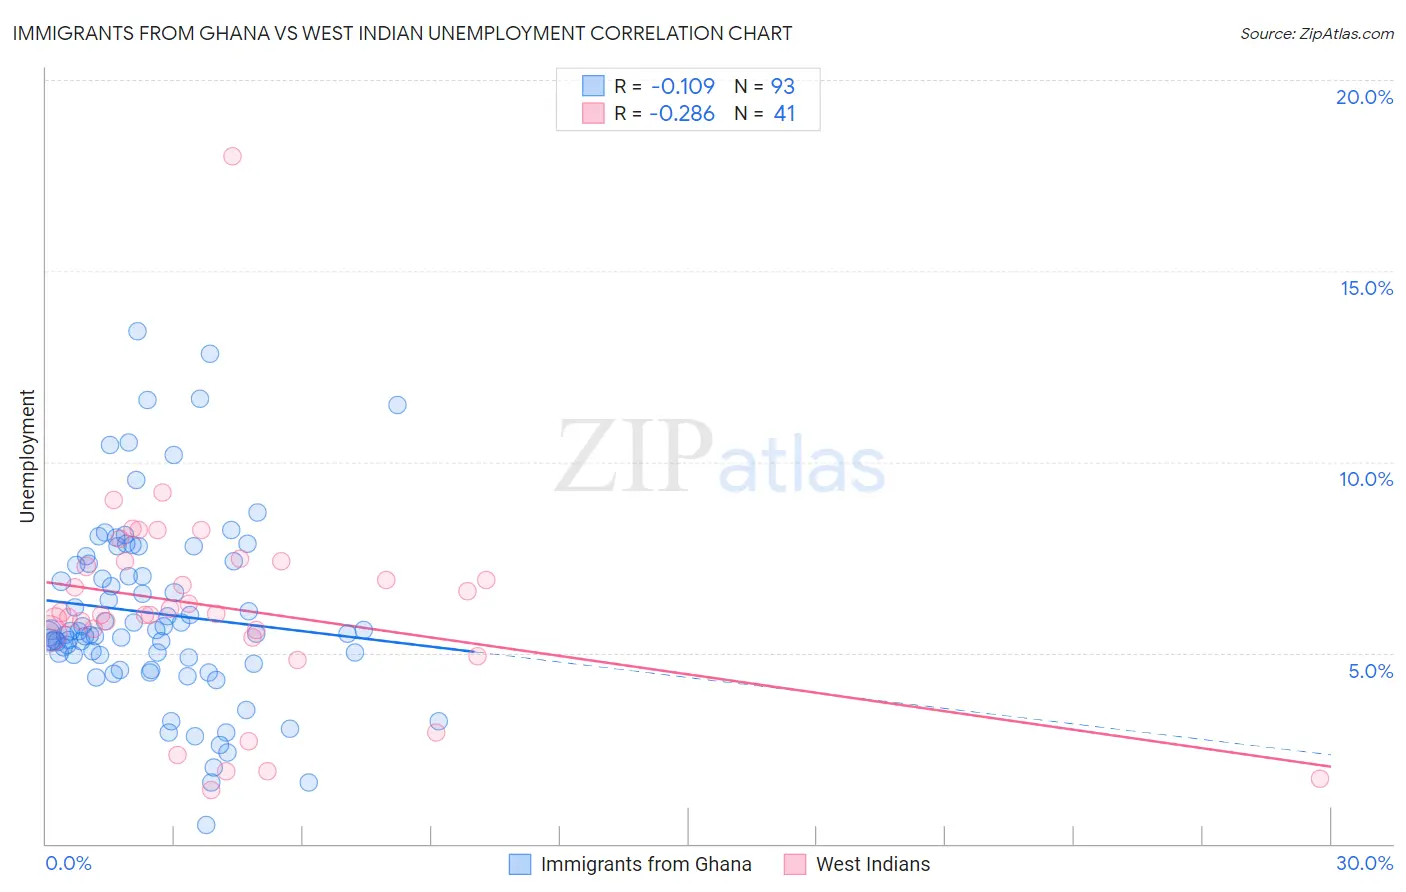
Immigrants from Ghana vs West Indian Unemployment Correlation Chart
The statistical analysis conducted on geographies consisting of 199,867,577 people shows a poor negative correlation between the proportion of Immigrants from Ghana and unemployment in the United States with a correlation coefficient (R) of -0.109 and weighted average of 6.1%. Similarly, the statistical analysis conducted on geographies consisting of 253,931,016 people shows a weak negative correlation between the proportion of West Indians and unemployment in the United States with a correlation coefficient (R) of -0.286 and weighted average of 6.4%, a difference of 4.9%.
Unemployment Correlation Summary
| Measurement | Immigrants from Ghana | West Indian |
| Minimum | 0.50% | 1.4% |
| Maximum | 13.4% | 18.0% |
| Range | 12.9% | 16.6% |
| Mean | 6.0% | 6.2% |
| Median | 5.6% | 6.0% |
| Interquartile 25% (IQ1) | 4.9% | 5.5% |
| Interquartile 75% (IQ3) | 7.4% | 7.4% |
| Interquartile Range (IQR) | 2.5% | 1.9% |
| Standard Deviation (Sample) | 2.4% | 2.8% |
| Standard Deviation (Population) | 2.4% | 2.7% |
Demographics Similar to Immigrants from Ghana and West Indians by Unemployment
In terms of unemployment, the demographic groups most similar to Immigrants from Ghana are Immigrants from the Azores (6.1%, a difference of 0.080%), Aleut (6.1%, a difference of 0.13%), Immigrants from Senegal (6.1%, a difference of 1.1%), Immigrants from Caribbean (6.2%, a difference of 1.5%), and Nepalese (6.2%, a difference of 1.8%). Similarly, the demographic groups most similar to West Indians are Trinidadian and Tobagonian (6.3%, a difference of 0.25%), Immigrants from Trinidad and Tobago (6.3%, a difference of 0.74%), Immigrants from West Indies (6.3%, a difference of 0.86%), Immigrants from Haiti (6.3%, a difference of 0.90%), and Jamaican (6.3%, a difference of 1.0%).
| Demographics | Rating | Rank | Unemployment |
| Immigrants | Azores | 0.0 /100 | #282 | Tragic 6.1% |
| Immigrants | Ghana | 0.0 /100 | #283 | Tragic 6.1% |
| Aleuts | 0.0 /100 | #284 | Tragic 6.1% |
| Immigrants | Senegal | 0.0 /100 | #285 | Tragic 6.1% |
| Immigrants | Caribbean | 0.0 /100 | #286 | Tragic 6.2% |
| Nepalese | 0.0 /100 | #287 | Tragic 6.2% |
| Ecuadorians | 0.0 /100 | #288 | Tragic 6.2% |
| Chippewa | 0.0 /100 | #289 | Tragic 6.2% |
| Senegalese | 0.0 /100 | #290 | Tragic 6.2% |
| Haitians | 0.0 /100 | #291 | Tragic 6.2% |
| Central American Indians | 0.0 /100 | #292 | Tragic 6.2% |
| Immigrants | Ecuador | 0.0 /100 | #293 | Tragic 6.2% |
| Spanish American Indians | 0.0 /100 | #294 | Tragic 6.2% |
| U.S. Virgin Islanders | 0.0 /100 | #295 | Tragic 6.3% |
| Ute | 0.0 /100 | #296 | Tragic 6.3% |
| Jamaicans | 0.0 /100 | #297 | Tragic 6.3% |
| Immigrants | Haiti | 0.0 /100 | #298 | Tragic 6.3% |
| Immigrants | West Indies | 0.0 /100 | #299 | Tragic 6.3% |
| Immigrants | Trinidad and Tobago | 0.0 /100 | #300 | Tragic 6.3% |
| Trinidadians and Tobagonians | 0.0 /100 | #301 | Tragic 6.3% |
| West Indians | 0.0 /100 | #302 | Tragic 6.4% |