Immigrants from North Macedonia vs Immigrants from Greece Unemployment
COMPARE
Immigrants from North Macedonia
Immigrants from Greece
Unemployment
Unemployment Comparison
Immigrants from North Macedonia
Immigrants from Greece
5.0%
UNEMPLOYMENT
96.3/ 100
METRIC RATING
90th/ 347
METRIC RANK
5.3%
UNEMPLOYMENT
45.0/ 100
METRIC RATING
180th/ 347
METRIC RANK
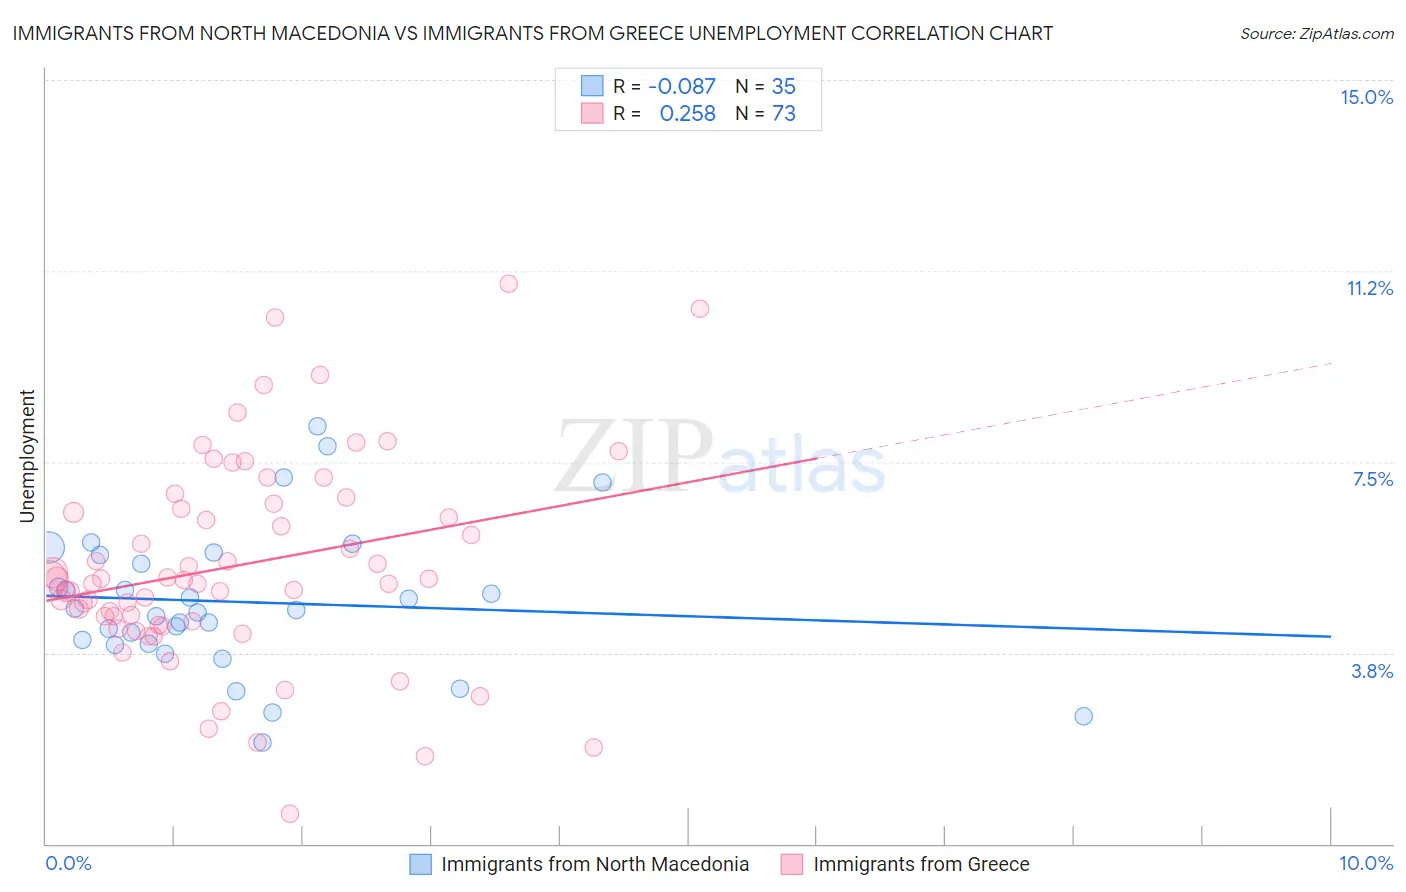
Immigrants from North Macedonia vs Immigrants from Greece Unemployment Correlation Chart
The statistical analysis conducted on geographies consisting of 74,281,538 people shows a slight negative correlation between the proportion of Immigrants from North Macedonia and unemployment in the United States with a correlation coefficient (R) of -0.087 and weighted average of 5.0%. Similarly, the statistical analysis conducted on geographies consisting of 216,814,520 people shows a weak positive correlation between the proportion of Immigrants from Greece and unemployment in the United States with a correlation coefficient (R) of 0.258 and weighted average of 5.3%, a difference of 5.6%.
Unemployment Correlation Summary
| Measurement | Immigrants from North Macedonia | Immigrants from Greece |
| Minimum | 2.0% | 0.60% |
| Maximum | 8.2% | 11.0% |
| Range | 6.2% | 10.4% |
| Mean | 4.7% | 5.5% |
| Median | 4.6% | 5.2% |
| Interquartile 25% (IQ1) | 3.9% | 4.3% |
| Interquartile 75% (IQ3) | 5.7% | 6.6% |
| Interquartile Range (IQR) | 1.8% | 2.3% |
| Standard Deviation (Sample) | 1.4% | 2.0% |
| Standard Deviation (Population) | 1.4% | 2.0% |
Similar Demographics by Unemployment
Demographics Similar to Immigrants from North Macedonia by Unemployment
In terms of unemployment, the demographic groups most similar to Immigrants from North Macedonia are Immigrants from Sudan (5.0%, a difference of 0.010%), Immigrants from South Africa (5.0%, a difference of 0.030%), Jordanian (5.0%, a difference of 0.040%), Ukrainian (5.0%, a difference of 0.12%), and Immigrants from Korea (5.0%, a difference of 0.13%).
| Demographics | Rating | Rank | Unemployment |
| Hmong | 97.6 /100 | #83 | Exceptional 5.0% |
| Russians | 97.4 /100 | #84 | Exceptional 5.0% |
| Immigrants | Australia | 97.0 /100 | #85 | Exceptional 5.0% |
| Hungarians | 96.9 /100 | #86 | Exceptional 5.0% |
| Immigrants | Moldova | 96.6 /100 | #87 | Exceptional 5.0% |
| Immigrants | Korea | 96.6 /100 | #88 | Exceptional 5.0% |
| Jordanians | 96.4 /100 | #89 | Exceptional 5.0% |
| Immigrants | North Macedonia | 96.3 /100 | #90 | Exceptional 5.0% |
| Immigrants | Sudan | 96.3 /100 | #91 | Exceptional 5.0% |
| Immigrants | South Africa | 96.2 /100 | #92 | Exceptional 5.0% |
| Ukrainians | 96.0 /100 | #93 | Exceptional 5.0% |
| Immigrants | Austria | 95.9 /100 | #94 | Exceptional 5.0% |
| Immigrants | Serbia | 95.6 /100 | #95 | Exceptional 5.0% |
| Immigrants | England | 95.2 /100 | #96 | Exceptional 5.0% |
| Immigrants | Czechoslovakia | 95.1 /100 | #97 | Exceptional 5.0% |
Demographics Similar to Immigrants from Greece by Unemployment
In terms of unemployment, the demographic groups most similar to Immigrants from Greece are Albanian (5.3%, a difference of 0.090%), Malaysian (5.3%, a difference of 0.11%), Afghan (5.3%, a difference of 0.15%), Nonimmigrants (5.3%, a difference of 0.18%), and Spaniard (5.3%, a difference of 0.18%).
| Demographics | Rating | Rank | Unemployment |
| Immigrants | Poland | 51.8 /100 | #173 | Average 5.3% |
| Immigrants | Congo | 50.0 /100 | #174 | Average 5.3% |
| Taiwanese | 49.6 /100 | #175 | Average 5.3% |
| Nicaraguans | 48.7 /100 | #176 | Average 5.3% |
| Immigrants | Nonimmigrants | 47.9 /100 | #177 | Average 5.3% |
| Afghans | 47.4 /100 | #178 | Average 5.3% |
| Malaysians | 46.8 /100 | #179 | Average 5.3% |
| Immigrants | Greece | 45.0 /100 | #180 | Average 5.3% |
| Albanians | 43.5 /100 | #181 | Average 5.3% |
| Spaniards | 42.2 /100 | #182 | Average 5.3% |
| Brazilians | 40.2 /100 | #183 | Average 5.3% |
| Assyrians/Chaldeans/Syriacs | 39.2 /100 | #184 | Fair 5.3% |
| Immigrants | Thailand | 38.9 /100 | #185 | Fair 5.3% |
| Immigrants | Uganda | 37.8 /100 | #186 | Fair 5.3% |
| Costa Ricans | 37.4 /100 | #187 | Fair 5.3% |