Immigrants from North Macedonia vs Houma Unemployment
COMPARE
Immigrants from North Macedonia
Houma
Unemployment
Unemployment Comparison
Immigrants from North Macedonia
Houma
5.0%
UNEMPLOYMENT
96.3/ 100
METRIC RATING
90th/ 347
METRIC RANK
6.7%
UNEMPLOYMENT
0.0/ 100
METRIC RATING
315th/ 347
METRIC RANK
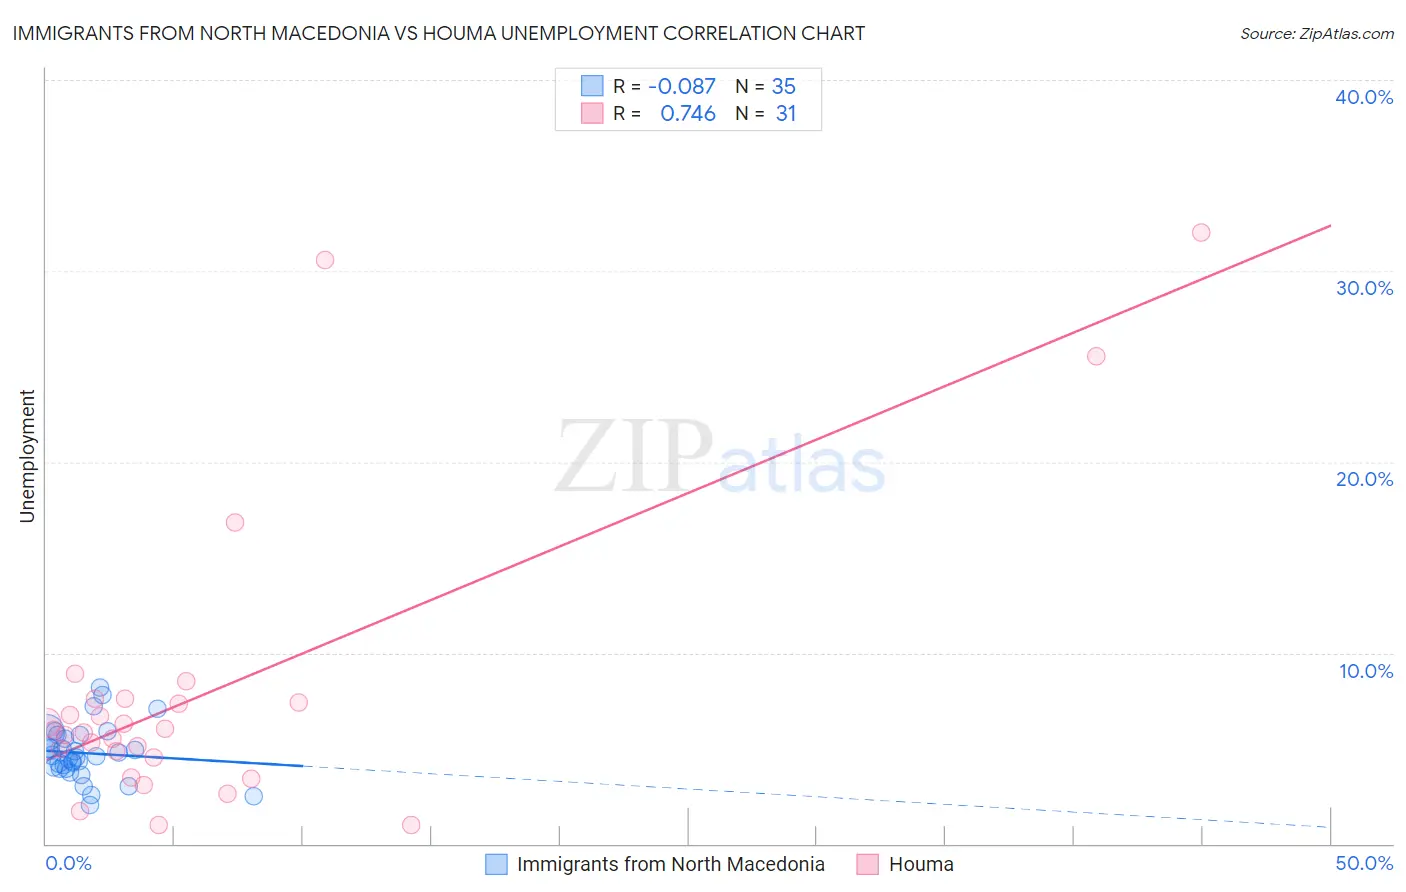
Immigrants from North Macedonia vs Houma Unemployment Correlation Chart
The statistical analysis conducted on geographies consisting of 74,281,538 people shows a slight negative correlation between the proportion of Immigrants from North Macedonia and unemployment in the United States with a correlation coefficient (R) of -0.087 and weighted average of 5.0%. Similarly, the statistical analysis conducted on geographies consisting of 36,775,803 people shows a strong positive correlation between the proportion of Houma and unemployment in the United States with a correlation coefficient (R) of 0.746 and weighted average of 6.7%, a difference of 33.9%.
Unemployment Correlation Summary
| Measurement | Immigrants from North Macedonia | Houma |
| Minimum | 2.0% | 1.0% |
| Maximum | 8.2% | 32.0% |
| Range | 6.2% | 31.0% |
| Mean | 4.7% | 8.0% |
| Median | 4.6% | 6.0% |
| Interquartile 25% (IQ1) | 3.9% | 4.5% |
| Interquartile 75% (IQ3) | 5.7% | 7.6% |
| Interquartile Range (IQR) | 1.8% | 3.1% |
| Standard Deviation (Sample) | 1.4% | 7.7% |
| Standard Deviation (Population) | 1.4% | 7.6% |
Similar Demographics by Unemployment
Demographics Similar to Immigrants from North Macedonia by Unemployment
In terms of unemployment, the demographic groups most similar to Immigrants from North Macedonia are Immigrants from Sudan (5.0%, a difference of 0.010%), Immigrants from South Africa (5.0%, a difference of 0.030%), Jordanian (5.0%, a difference of 0.040%), Ukrainian (5.0%, a difference of 0.12%), and Immigrants from Korea (5.0%, a difference of 0.13%).
| Demographics | Rating | Rank | Unemployment |
| Hmong | 97.6 /100 | #83 | Exceptional 5.0% |
| Russians | 97.4 /100 | #84 | Exceptional 5.0% |
| Immigrants | Australia | 97.0 /100 | #85 | Exceptional 5.0% |
| Hungarians | 96.9 /100 | #86 | Exceptional 5.0% |
| Immigrants | Moldova | 96.6 /100 | #87 | Exceptional 5.0% |
| Immigrants | Korea | 96.6 /100 | #88 | Exceptional 5.0% |
| Jordanians | 96.4 /100 | #89 | Exceptional 5.0% |
| Immigrants | North Macedonia | 96.3 /100 | #90 | Exceptional 5.0% |
| Immigrants | Sudan | 96.3 /100 | #91 | Exceptional 5.0% |
| Immigrants | South Africa | 96.2 /100 | #92 | Exceptional 5.0% |
| Ukrainians | 96.0 /100 | #93 | Exceptional 5.0% |
| Immigrants | Austria | 95.9 /100 | #94 | Exceptional 5.0% |
| Immigrants | Serbia | 95.6 /100 | #95 | Exceptional 5.0% |
| Immigrants | England | 95.2 /100 | #96 | Exceptional 5.0% |
| Immigrants | Czechoslovakia | 95.1 /100 | #97 | Exceptional 5.0% |
Demographics Similar to Houma by Unemployment
In terms of unemployment, the demographic groups most similar to Houma are Black/African American (6.6%, a difference of 0.80%), Immigrants from Dominica (6.7%, a difference of 0.83%), Immigrants from Barbados (6.6%, a difference of 1.3%), Shoshone (6.8%, a difference of 1.4%), and Colville (6.6%, a difference of 1.7%).
| Demographics | Rating | Rank | Unemployment |
| Barbadians | 0.0 /100 | #308 | Tragic 6.5% |
| Vietnamese | 0.0 /100 | #309 | Tragic 6.5% |
| Immigrants | Belize | 0.0 /100 | #310 | Tragic 6.5% |
| Cape Verdeans | 0.0 /100 | #311 | Tragic 6.5% |
| Colville | 0.0 /100 | #312 | Tragic 6.6% |
| Immigrants | Barbados | 0.0 /100 | #313 | Tragic 6.6% |
| Blacks/African Americans | 0.0 /100 | #314 | Tragic 6.6% |
| Houma | 0.0 /100 | #315 | Tragic 6.7% |
| Immigrants | Dominica | 0.0 /100 | #316 | Tragic 6.7% |
| Shoshone | 0.0 /100 | #317 | Tragic 6.8% |
| Immigrants | Cabo Verde | 0.0 /100 | #318 | Tragic 6.8% |
| British West Indians | 0.0 /100 | #319 | Tragic 6.8% |
| Immigrants | St. Vincent and the Grenadines | 0.0 /100 | #320 | Tragic 6.9% |
| Immigrants | Guyana | 0.0 /100 | #321 | Tragic 6.9% |
| Guyanese | 0.0 /100 | #322 | Tragic 6.9% |