Immigrants from North Macedonia vs Irish Unemployment
COMPARE
Immigrants from North Macedonia
Irish
Unemployment
Unemployment Comparison
Immigrants from North Macedonia
Irish
5.0%
UNEMPLOYMENT
96.3/ 100
METRIC RATING
90th/ 347
METRIC RANK
4.8%
UNEMPLOYMENT
99.8/ 100
METRIC RATING
30th/ 347
METRIC RANK
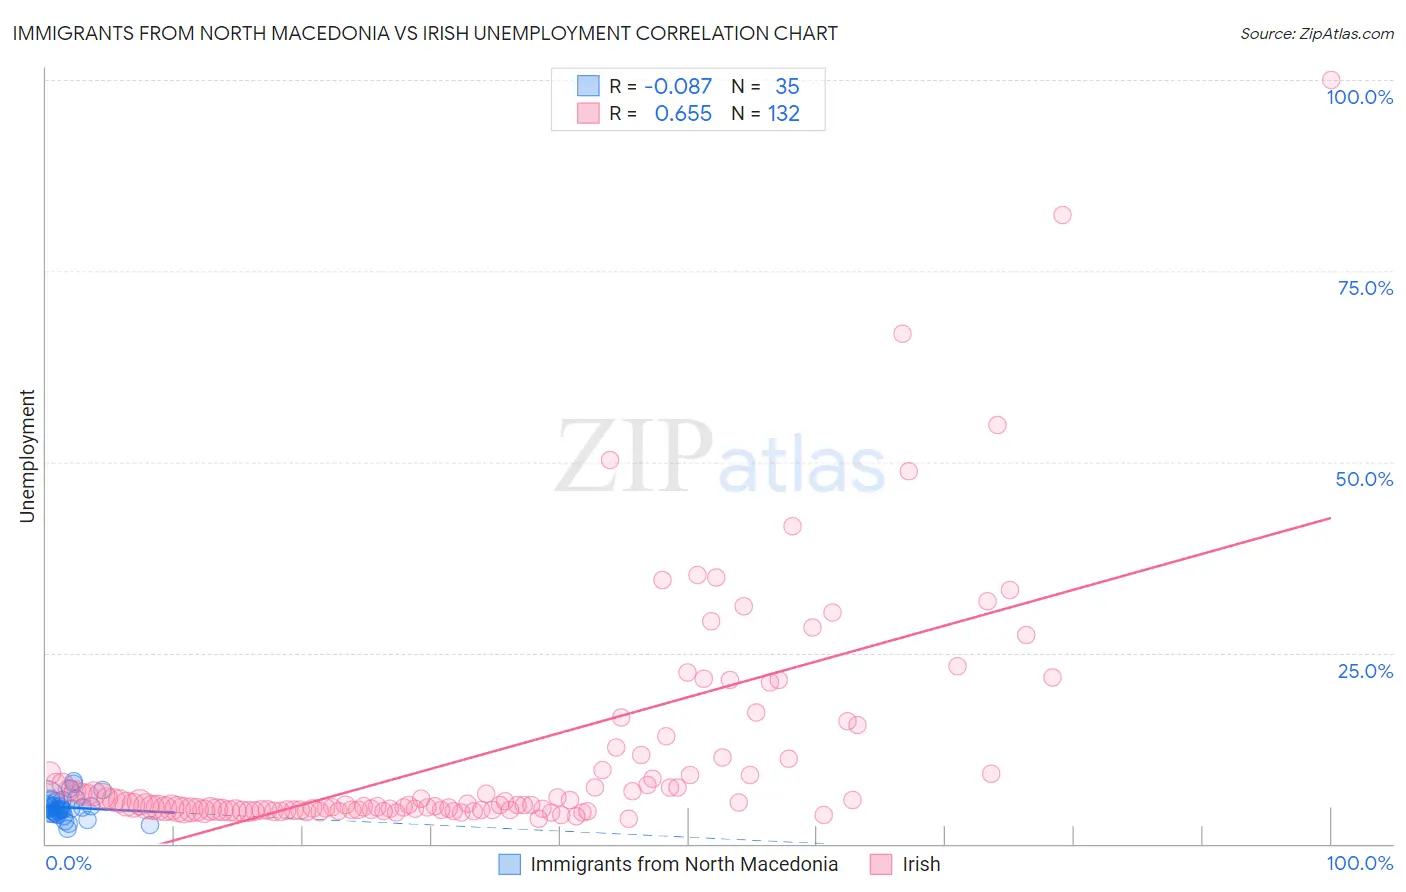
Immigrants from North Macedonia vs Irish Unemployment Correlation Chart
The statistical analysis conducted on geographies consisting of 74,281,538 people shows a slight negative correlation between the proportion of Immigrants from North Macedonia and unemployment in the United States with a correlation coefficient (R) of -0.087 and weighted average of 5.0%. Similarly, the statistical analysis conducted on geographies consisting of 574,923,792 people shows a significant positive correlation between the proportion of Irish and unemployment in the United States with a correlation coefficient (R) of 0.655 and weighted average of 4.8%, a difference of 5.0%.
Unemployment Correlation Summary
| Measurement | Immigrants from North Macedonia | Irish |
| Minimum | 2.0% | 3.3% |
| Maximum | 8.2% | 100.0% |
| Range | 6.2% | 96.7% |
| Mean | 4.7% | 11.8% |
| Median | 4.6% | 5.1% |
| Interquartile 25% (IQ1) | 3.9% | 4.5% |
| Interquartile 75% (IQ3) | 5.7% | 10.3% |
| Interquartile Range (IQR) | 1.8% | 5.9% |
| Standard Deviation (Sample) | 1.4% | 15.3% |
| Standard Deviation (Population) | 1.4% | 15.2% |
Similar Demographics by Unemployment
Demographics Similar to Immigrants from North Macedonia by Unemployment
In terms of unemployment, the demographic groups most similar to Immigrants from North Macedonia are Immigrants from Sudan (5.0%, a difference of 0.010%), Immigrants from South Africa (5.0%, a difference of 0.030%), Jordanian (5.0%, a difference of 0.040%), Ukrainian (5.0%, a difference of 0.12%), and Immigrants from Korea (5.0%, a difference of 0.13%).
| Demographics | Rating | Rank | Unemployment |
| Hmong | 97.6 /100 | #83 | Exceptional 5.0% |
| Russians | 97.4 /100 | #84 | Exceptional 5.0% |
| Immigrants | Australia | 97.0 /100 | #85 | Exceptional 5.0% |
| Hungarians | 96.9 /100 | #86 | Exceptional 5.0% |
| Immigrants | Moldova | 96.6 /100 | #87 | Exceptional 5.0% |
| Immigrants | Korea | 96.6 /100 | #88 | Exceptional 5.0% |
| Jordanians | 96.4 /100 | #89 | Exceptional 5.0% |
| Immigrants | North Macedonia | 96.3 /100 | #90 | Exceptional 5.0% |
| Immigrants | Sudan | 96.3 /100 | #91 | Exceptional 5.0% |
| Immigrants | South Africa | 96.2 /100 | #92 | Exceptional 5.0% |
| Ukrainians | 96.0 /100 | #93 | Exceptional 5.0% |
| Immigrants | Austria | 95.9 /100 | #94 | Exceptional 5.0% |
| Immigrants | Serbia | 95.6 /100 | #95 | Exceptional 5.0% |
| Immigrants | England | 95.2 /100 | #96 | Exceptional 5.0% |
| Immigrants | Czechoslovakia | 95.1 /100 | #97 | Exceptional 5.0% |
Demographics Similar to Irish by Unemployment
In terms of unemployment, the demographic groups most similar to Irish are Croatian (4.8%, a difference of 0.020%), Zimbabwean (4.8%, a difference of 0.12%), Sudanese (4.8%, a difference of 0.13%), Immigrants from Bolivia (4.8%, a difference of 0.17%), and Polish (4.7%, a difference of 0.24%).
| Demographics | Rating | Rank | Unemployment |
| British | 99.9 /100 | #23 | Exceptional 4.7% |
| Venezuelans | 99.9 /100 | #24 | Exceptional 4.7% |
| Latvians | 99.9 /100 | #25 | Exceptional 4.7% |
| Bulgarians | 99.9 /100 | #26 | Exceptional 4.7% |
| Finns | 99.9 /100 | #27 | Exceptional 4.7% |
| Cubans | 99.8 /100 | #28 | Exceptional 4.7% |
| Poles | 99.8 /100 | #29 | Exceptional 4.7% |
| Irish | 99.8 /100 | #30 | Exceptional 4.8% |
| Croatians | 99.8 /100 | #31 | Exceptional 4.8% |
| Zimbabweans | 99.8 /100 | #32 | Exceptional 4.8% |
| Sudanese | 99.8 /100 | #33 | Exceptional 4.8% |
| Immigrants | Bolivia | 99.8 /100 | #34 | Exceptional 4.8% |
| Scotch-Irish | 99.8 /100 | #35 | Exceptional 4.8% |
| Tongans | 99.7 /100 | #36 | Exceptional 4.8% |
| Czechoslovakians | 99.7 /100 | #37 | Exceptional 4.8% |