Immigrants from North Macedonia vs Immigrants from Ireland Unemployment
COMPARE
Immigrants from North Macedonia
Immigrants from Ireland
Unemployment
Unemployment Comparison
Immigrants from North Macedonia
Immigrants from Ireland
5.0%
UNEMPLOYMENT
96.3/ 100
METRIC RATING
90th/ 347
METRIC RANK
5.1%
UNEMPLOYMENT
92.1/ 100
METRIC RATING
114th/ 347
METRIC RANK
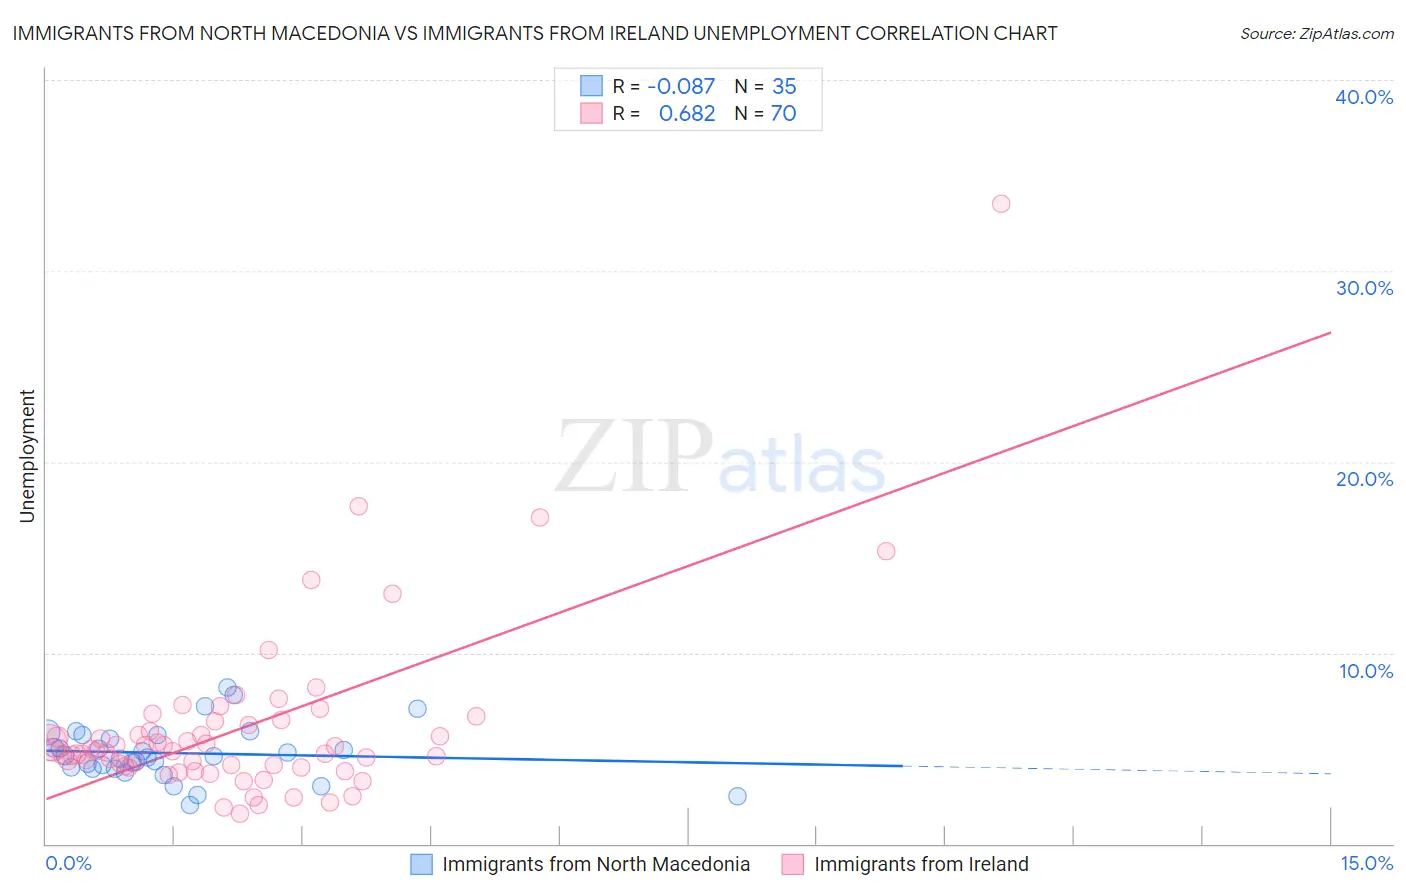
Immigrants from North Macedonia vs Immigrants from Ireland Unemployment Correlation Chart
The statistical analysis conducted on geographies consisting of 74,281,538 people shows a slight negative correlation between the proportion of Immigrants from North Macedonia and unemployment in the United States with a correlation coefficient (R) of -0.087 and weighted average of 5.0%. Similarly, the statistical analysis conducted on geographies consisting of 240,659,680 people shows a significant positive correlation between the proportion of Immigrants from Ireland and unemployment in the United States with a correlation coefficient (R) of 0.682 and weighted average of 5.1%, a difference of 1.3%.
Unemployment Correlation Summary
| Measurement | Immigrants from North Macedonia | Immigrants from Ireland |
| Minimum | 2.0% | 1.6% |
| Maximum | 8.2% | 33.5% |
| Range | 6.2% | 31.9% |
| Mean | 4.7% | 6.0% |
| Median | 4.6% | 4.9% |
| Interquartile 25% (IQ1) | 3.9% | 4.1% |
| Interquartile 75% (IQ3) | 5.7% | 6.2% |
| Interquartile Range (IQR) | 1.8% | 2.1% |
| Standard Deviation (Sample) | 1.4% | 4.6% |
| Standard Deviation (Population) | 1.4% | 4.6% |
Similar Demographics by Unemployment
Demographics Similar to Immigrants from North Macedonia by Unemployment
In terms of unemployment, the demographic groups most similar to Immigrants from North Macedonia are Immigrants from Sudan (5.0%, a difference of 0.010%), Immigrants from South Africa (5.0%, a difference of 0.030%), Jordanian (5.0%, a difference of 0.040%), Ukrainian (5.0%, a difference of 0.12%), and Immigrants from Korea (5.0%, a difference of 0.13%).
| Demographics | Rating | Rank | Unemployment |
| Hmong | 97.6 /100 | #83 | Exceptional 5.0% |
| Russians | 97.4 /100 | #84 | Exceptional 5.0% |
| Immigrants | Australia | 97.0 /100 | #85 | Exceptional 5.0% |
| Hungarians | 96.9 /100 | #86 | Exceptional 5.0% |
| Immigrants | Moldova | 96.6 /100 | #87 | Exceptional 5.0% |
| Immigrants | Korea | 96.6 /100 | #88 | Exceptional 5.0% |
| Jordanians | 96.4 /100 | #89 | Exceptional 5.0% |
| Immigrants | North Macedonia | 96.3 /100 | #90 | Exceptional 5.0% |
| Immigrants | Sudan | 96.3 /100 | #91 | Exceptional 5.0% |
| Immigrants | South Africa | 96.2 /100 | #92 | Exceptional 5.0% |
| Ukrainians | 96.0 /100 | #93 | Exceptional 5.0% |
| Immigrants | Austria | 95.9 /100 | #94 | Exceptional 5.0% |
| Immigrants | Serbia | 95.6 /100 | #95 | Exceptional 5.0% |
| Immigrants | England | 95.2 /100 | #96 | Exceptional 5.0% |
| Immigrants | Czechoslovakia | 95.1 /100 | #97 | Exceptional 5.0% |
Demographics Similar to Immigrants from Ireland by Unemployment
In terms of unemployment, the demographic groups most similar to Immigrants from Ireland are Argentinean (5.1%, a difference of 0.060%), South African (5.1%, a difference of 0.10%), Immigrants from Western Europe (5.1%, a difference of 0.21%), Immigrants from Sri Lanka (5.1%, a difference of 0.22%), and Immigrants from Malaysia (5.1%, a difference of 0.24%).
| Demographics | Rating | Rank | Unemployment |
| Immigrants | Turkey | 93.7 /100 | #107 | Exceptional 5.0% |
| Immigrants | Kuwait | 93.7 /100 | #108 | Exceptional 5.0% |
| Immigrants | Eritrea | 93.3 /100 | #109 | Exceptional 5.0% |
| Immigrants | Lithuania | 93.2 /100 | #110 | Exceptional 5.0% |
| Chileans | 93.2 /100 | #111 | Exceptional 5.0% |
| South Africans | 92.6 /100 | #112 | Exceptional 5.1% |
| Argentineans | 92.4 /100 | #113 | Exceptional 5.1% |
| Immigrants | Ireland | 92.1 /100 | #114 | Exceptional 5.1% |
| Immigrants | Western Europe | 91.1 /100 | #115 | Exceptional 5.1% |
| Immigrants | Sri Lanka | 91.1 /100 | #116 | Exceptional 5.1% |
| Immigrants | Malaysia | 91.0 /100 | #117 | Exceptional 5.1% |
| Immigrants | Germany | 90.8 /100 | #118 | Exceptional 5.1% |
| Immigrants | France | 89.7 /100 | #119 | Excellent 5.1% |
| Macedonians | 89.7 /100 | #120 | Excellent 5.1% |
| Lebanese | 89.2 /100 | #121 | Excellent 5.1% |