Immigrants from Kenya vs West Indian Unemployment
COMPARE
Immigrants from Kenya
West Indian
Unemployment
Unemployment Comparison
Immigrants from Kenya
West Indians
5.1%
UNEMPLOYMENT
88.2/ 100
METRIC RATING
127th/ 347
METRIC RANK
6.4%
UNEMPLOYMENT
0.0/ 100
METRIC RATING
302nd/ 347
METRIC RANK
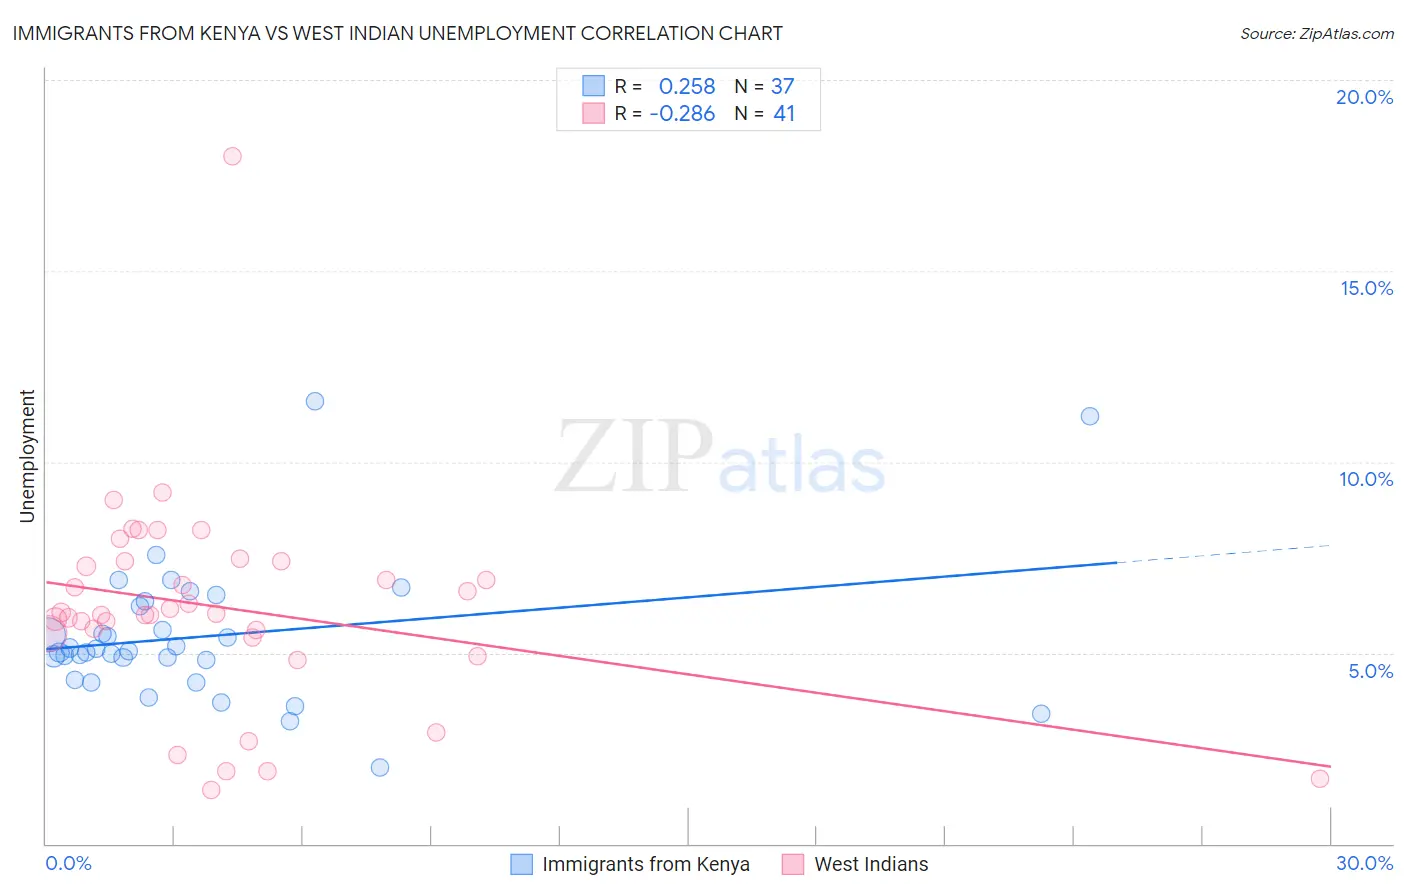
Immigrants from Kenya vs West Indian Unemployment Correlation Chart
The statistical analysis conducted on geographies consisting of 217,993,568 people shows a weak positive correlation between the proportion of Immigrants from Kenya and unemployment in the United States with a correlation coefficient (R) of 0.258 and weighted average of 5.1%. Similarly, the statistical analysis conducted on geographies consisting of 253,931,016 people shows a weak negative correlation between the proportion of West Indians and unemployment in the United States with a correlation coefficient (R) of -0.286 and weighted average of 6.4%, a difference of 24.9%.
Unemployment Correlation Summary
| Measurement | Immigrants from Kenya | West Indian |
| Minimum | 2.0% | 1.4% |
| Maximum | 11.6% | 18.0% |
| Range | 9.6% | 16.6% |
| Mean | 5.4% | 6.2% |
| Median | 5.0% | 6.0% |
| Interquartile 25% (IQ1) | 4.5% | 5.5% |
| Interquartile 75% (IQ3) | 6.3% | 7.4% |
| Interquartile Range (IQR) | 1.7% | 1.9% |
| Standard Deviation (Sample) | 1.8% | 2.8% |
| Standard Deviation (Population) | 1.8% | 2.7% |
Similar Demographics by Unemployment
Demographics Similar to Immigrants from Kenya by Unemployment
In terms of unemployment, the demographic groups most similar to Immigrants from Kenya are Kenyan (5.1%, a difference of 0.0%), Immigrants from Eastern Asia (5.1%, a difference of 0.020%), Immigrants from Eastern Africa (5.1%, a difference of 0.020%), Immigrants from Latvia (5.1%, a difference of 0.020%), and Ethiopian (5.1%, a difference of 0.070%).
| Demographics | Rating | Rank | Unemployment |
| Macedonians | 89.7 /100 | #120 | Excellent 5.1% |
| Lebanese | 89.2 /100 | #121 | Excellent 5.1% |
| Immigrants | Switzerland | 89.1 /100 | #122 | Excellent 5.1% |
| Asians | 89.0 /100 | #123 | Excellent 5.1% |
| Ethiopians | 88.6 /100 | #124 | Excellent 5.1% |
| Immigrants | Eastern Asia | 88.3 /100 | #125 | Excellent 5.1% |
| Kenyans | 88.2 /100 | #126 | Excellent 5.1% |
| Immigrants | Kenya | 88.2 /100 | #127 | Excellent 5.1% |
| Immigrants | Eastern Africa | 88.1 /100 | #128 | Excellent 5.1% |
| Immigrants | Latvia | 88.0 /100 | #129 | Excellent 5.1% |
| Iranians | 86.9 /100 | #130 | Excellent 5.1% |
| Immigrants | Croatia | 86.8 /100 | #131 | Excellent 5.1% |
| Immigrants | Ethiopia | 86.7 /100 | #132 | Excellent 5.1% |
| Immigrants | Jordan | 86.6 /100 | #133 | Excellent 5.1% |
| Immigrants | Europe | 86.3 /100 | #134 | Excellent 5.1% |
Demographics Similar to West Indians by Unemployment
In terms of unemployment, the demographic groups most similar to West Indians are Belizean (6.4%, a difference of 0.23%), Trinidadian and Tobagonian (6.3%, a difference of 0.25%), Immigrants from Trinidad and Tobago (6.3%, a difference of 0.74%), Immigrants from West Indies (6.3%, a difference of 0.86%), and Immigrants from Haiti (6.3%, a difference of 0.90%).
| Demographics | Rating | Rank | Unemployment |
| U.S. Virgin Islanders | 0.0 /100 | #295 | Tragic 6.3% |
| Ute | 0.0 /100 | #296 | Tragic 6.3% |
| Jamaicans | 0.0 /100 | #297 | Tragic 6.3% |
| Immigrants | Haiti | 0.0 /100 | #298 | Tragic 6.3% |
| Immigrants | West Indies | 0.0 /100 | #299 | Tragic 6.3% |
| Immigrants | Trinidad and Tobago | 0.0 /100 | #300 | Tragic 6.3% |
| Trinidadians and Tobagonians | 0.0 /100 | #301 | Tragic 6.3% |
| West Indians | 0.0 /100 | #302 | Tragic 6.4% |
| Belizeans | 0.0 /100 | #303 | Tragic 6.4% |
| Immigrants | Jamaica | 0.0 /100 | #304 | Tragic 6.4% |
| Menominee | 0.0 /100 | #305 | Tragic 6.4% |
| Lumbee | 0.0 /100 | #306 | Tragic 6.4% |
| Immigrants | Bangladesh | 0.0 /100 | #307 | Tragic 6.5% |
| Barbadians | 0.0 /100 | #308 | Tragic 6.5% |
| Vietnamese | 0.0 /100 | #309 | Tragic 6.5% |