Menominee vs West Indian Unemployment
COMPARE
Menominee
West Indian
Unemployment
Unemployment Comparison
Menominee
West Indians
6.4%
UNEMPLOYMENT
0.0/ 100
METRIC RATING
305th/ 347
METRIC RANK
6.4%
UNEMPLOYMENT
0.0/ 100
METRIC RATING
302nd/ 347
METRIC RANK
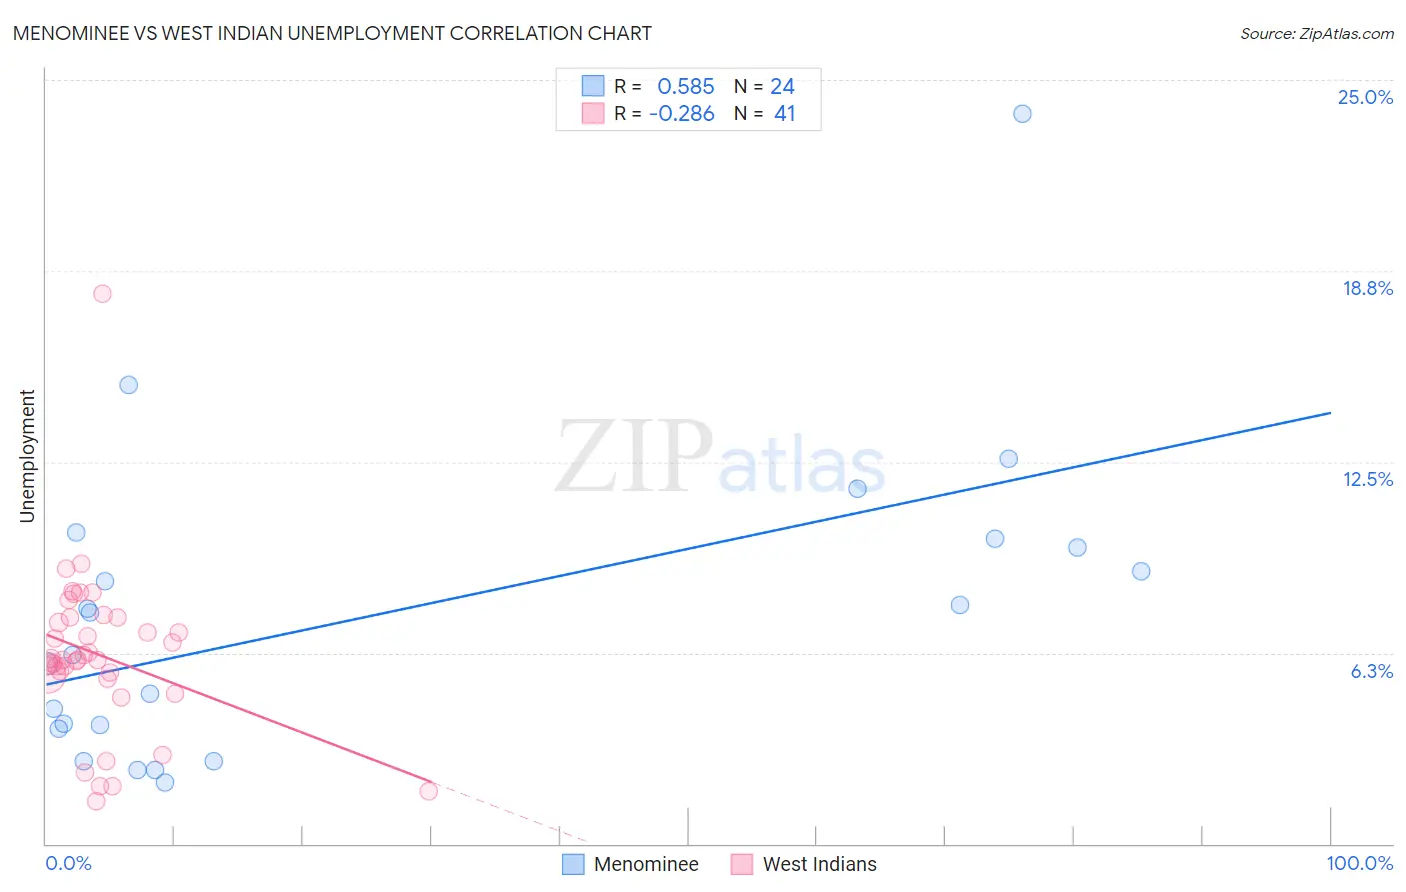
Menominee vs West Indian Unemployment Correlation Chart
The statistical analysis conducted on geographies consisting of 45,752,789 people shows a substantial positive correlation between the proportion of Menominee and unemployment in the United States with a correlation coefficient (R) of 0.585 and weighted average of 6.4%. Similarly, the statistical analysis conducted on geographies consisting of 253,931,016 people shows a weak negative correlation between the proportion of West Indians and unemployment in the United States with a correlation coefficient (R) of -0.286 and weighted average of 6.4%, a difference of 1.2%.
Unemployment Correlation Summary
| Measurement | Menominee | West Indian |
| Minimum | 2.0% | 1.4% |
| Maximum | 23.9% | 18.0% |
| Range | 21.9% | 16.6% |
| Mean | 7.4% | 6.2% |
| Median | 6.9% | 6.0% |
| Interquartile 25% (IQ1) | 3.8% | 5.5% |
| Interquartile 75% (IQ3) | 9.8% | 7.4% |
| Interquartile Range (IQR) | 6.0% | 1.9% |
| Standard Deviation (Sample) | 5.0% | 2.8% |
| Standard Deviation (Population) | 4.9% | 2.7% |
Demographics Similar to Menominee and West Indians by Unemployment
In terms of unemployment, the demographic groups most similar to Menominee are Lumbee (6.4%, a difference of 0.030%), Immigrants from Jamaica (6.4%, a difference of 0.25%), Immigrants from Bangladesh (6.5%, a difference of 0.52%), Barbadian (6.5%, a difference of 0.89%), and Vietnamese (6.5%, a difference of 0.90%). Similarly, the demographic groups most similar to West Indians are Belizean (6.4%, a difference of 0.23%), Trinidadian and Tobagonian (6.3%, a difference of 0.25%), Immigrants from Trinidad and Tobago (6.3%, a difference of 0.74%), Immigrants from West Indies (6.3%, a difference of 0.86%), and Immigrants from Haiti (6.3%, a difference of 0.90%).
| Demographics | Rating | Rank | Unemployment |
| Immigrants | Ecuador | 0.0 /100 | #293 | Tragic 6.2% |
| Spanish American Indians | 0.0 /100 | #294 | Tragic 6.2% |
| U.S. Virgin Islanders | 0.0 /100 | #295 | Tragic 6.3% |
| Ute | 0.0 /100 | #296 | Tragic 6.3% |
| Jamaicans | 0.0 /100 | #297 | Tragic 6.3% |
| Immigrants | Haiti | 0.0 /100 | #298 | Tragic 6.3% |
| Immigrants | West Indies | 0.0 /100 | #299 | Tragic 6.3% |
| Immigrants | Trinidad and Tobago | 0.0 /100 | #300 | Tragic 6.3% |
| Trinidadians and Tobagonians | 0.0 /100 | #301 | Tragic 6.3% |
| West Indians | 0.0 /100 | #302 | Tragic 6.4% |
| Belizeans | 0.0 /100 | #303 | Tragic 6.4% |
| Immigrants | Jamaica | 0.0 /100 | #304 | Tragic 6.4% |
| Menominee | 0.0 /100 | #305 | Tragic 6.4% |
| Lumbee | 0.0 /100 | #306 | Tragic 6.4% |
| Immigrants | Bangladesh | 0.0 /100 | #307 | Tragic 6.5% |
| Barbadians | 0.0 /100 | #308 | Tragic 6.5% |
| Vietnamese | 0.0 /100 | #309 | Tragic 6.5% |
| Immigrants | Belize | 0.0 /100 | #310 | Tragic 6.5% |
| Cape Verdeans | 0.0 /100 | #311 | Tragic 6.5% |
| Colville | 0.0 /100 | #312 | Tragic 6.6% |
| Immigrants | Barbados | 0.0 /100 | #313 | Tragic 6.6% |