Immigrants from Honduras vs Armenian Unemployment Among Women with Children Ages 6 to 17 years
COMPARE
Immigrants from Honduras
Armenian
Unemployment Among Women with Children Ages 6 to 17 years
Unemployment Among Women with Children Ages 6 to 17 years Comparison
Immigrants from Honduras
Armenians
10.1%
UNEMPLOYMENT AMONG WOMEN WITH CHILDREN AGES 6 TO 17 YEARS
0.0/ 100
METRIC RATING
299th/ 347
METRIC RANK
8.3%
UNEMPLOYMENT AMONG WOMEN WITH CHILDREN AGES 6 TO 17 YEARS
99.9/ 100
METRIC RATING
67th/ 347
METRIC RANK
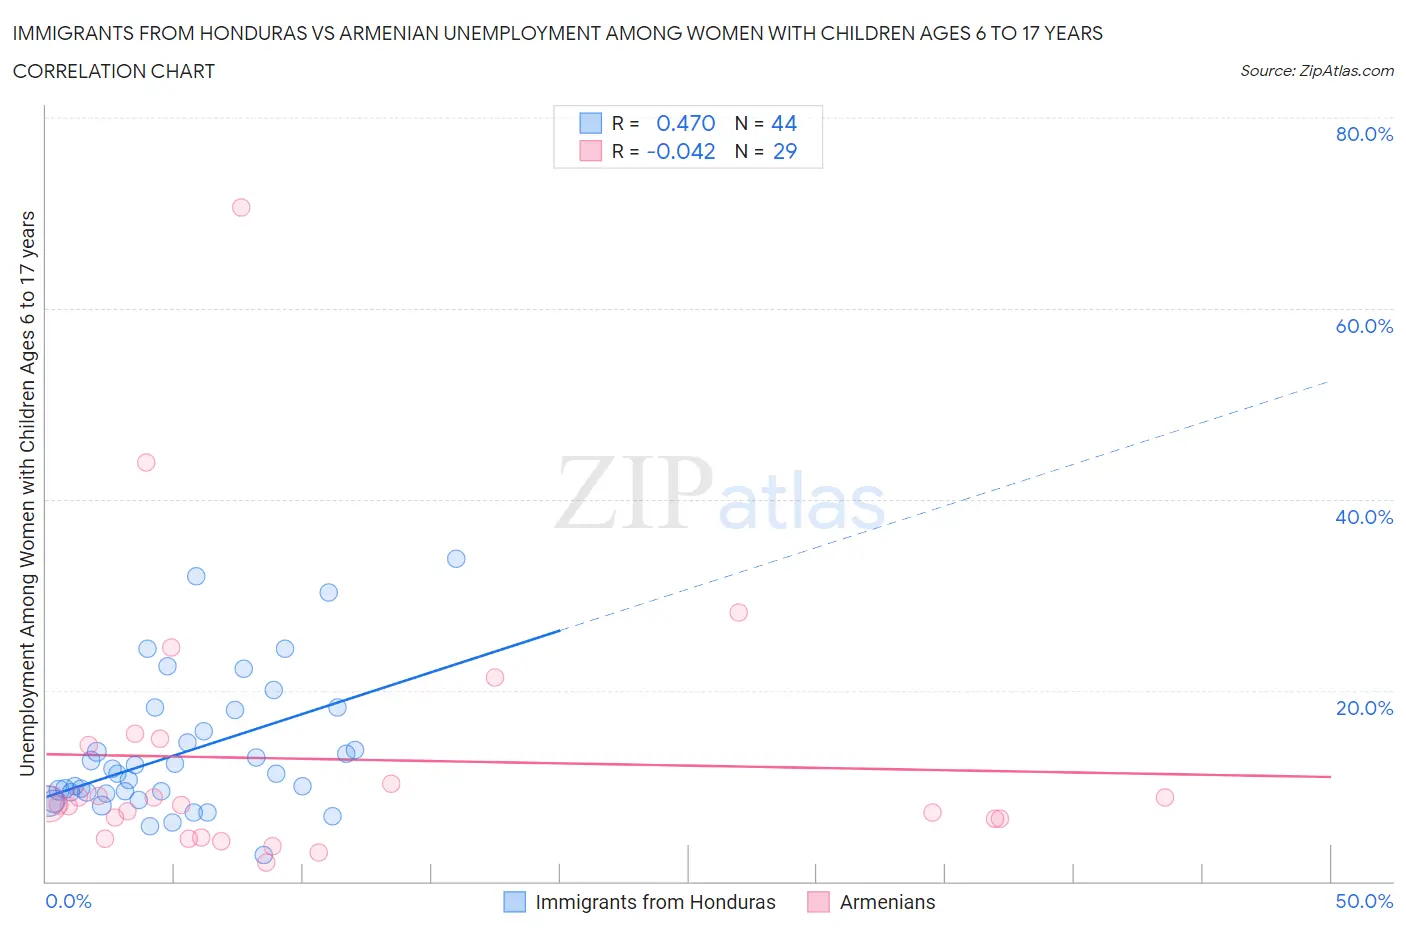
Immigrants from Honduras vs Armenian Unemployment Among Women with Children Ages 6 to 17 years Correlation Chart
The statistical analysis conducted on geographies consisting of 250,516,904 people shows a moderate positive correlation between the proportion of Immigrants from Honduras and unemployment rate among women with children between the ages 6 and 17 in the United States with a correlation coefficient (R) of 0.470 and weighted average of 10.1%. Similarly, the statistical analysis conducted on geographies consisting of 229,483,477 people shows no correlation between the proportion of Armenians and unemployment rate among women with children between the ages 6 and 17 in the United States with a correlation coefficient (R) of -0.042 and weighted average of 8.3%, a difference of 21.7%.
Unemployment Among Women with Children Ages 6 to 17 years Correlation Summary
| Measurement | Immigrants from Honduras | Armenian |
| Minimum | 2.7% | 1.9% |
| Maximum | 33.8% | 70.6% |
| Range | 31.1% | 68.7% |
| Mean | 13.5% | 12.8% |
| Median | 11.2% | 8.0% |
| Interquartile 25% (IQ1) | 9.3% | 5.6% |
| Interquartile 75% (IQ3) | 16.9% | 14.6% |
| Interquartile Range (IQR) | 7.6% | 9.0% |
| Standard Deviation (Sample) | 7.1% | 14.2% |
| Standard Deviation (Population) | 7.0% | 14.0% |
Similar Demographics by Unemployment Among Women with Children Ages 6 to 17 years
Demographics Similar to Immigrants from Honduras by Unemployment Among Women with Children Ages 6 to 17 years
In terms of unemployment among women with children ages 6 to 17 years, the demographic groups most similar to Immigrants from Honduras are Immigrants from Haiti (10.1%, a difference of 0.020%), Nigerian (10.1%, a difference of 0.020%), Immigrants from Bahamas (10.1%, a difference of 0.18%), Immigrants from Caribbean (10.1%, a difference of 0.32%), and Immigrants from Western Africa (10.1%, a difference of 0.34%).
| Demographics | Rating | Rank | Unemployment Among Women with Children Ages 6 to 17 years |
| Carpatho Rusyns | 0.0 /100 | #292 | Tragic 10.0% |
| Haitians | 0.0 /100 | #293 | Tragic 10.0% |
| Ecuadorians | 0.0 /100 | #294 | Tragic 10.0% |
| Cherokee | 0.0 /100 | #295 | Tragic 10.0% |
| Immigrants | Western Africa | 0.0 /100 | #296 | Tragic 10.1% |
| Immigrants | Caribbean | 0.0 /100 | #297 | Tragic 10.1% |
| Immigrants | Haiti | 0.0 /100 | #298 | Tragic 10.1% |
| Immigrants | Honduras | 0.0 /100 | #299 | Tragic 10.1% |
| Nigerians | 0.0 /100 | #300 | Tragic 10.1% |
| Immigrants | Bahamas | 0.0 /100 | #301 | Tragic 10.1% |
| Venezuelans | 0.0 /100 | #302 | Tragic 10.2% |
| Immigrants | Ecuador | 0.0 /100 | #303 | Tragic 10.2% |
| Immigrants | Venezuela | 0.0 /100 | #304 | Tragic 10.2% |
| Immigrants | Nigeria | 0.0 /100 | #305 | Tragic 10.2% |
| Paraguayans | 0.0 /100 | #306 | Tragic 10.2% |
Demographics Similar to Armenians by Unemployment Among Women with Children Ages 6 to 17 years
In terms of unemployment among women with children ages 6 to 17 years, the demographic groups most similar to Armenians are Marshallese (8.3%, a difference of 0.080%), Luxembourger (8.3%, a difference of 0.10%), Immigrants from Thailand (8.3%, a difference of 0.11%), Norwegian (8.3%, a difference of 0.19%), and Immigrants from Albania (8.3%, a difference of 0.23%).
| Demographics | Rating | Rank | Unemployment Among Women with Children Ages 6 to 17 years |
| Basques | 100.0 /100 | #60 | Exceptional 8.2% |
| Koreans | 100.0 /100 | #61 | Exceptional 8.2% |
| Spanish American Indians | 100.0 /100 | #62 | Exceptional 8.2% |
| Immigrants | South Eastern Asia | 99.9 /100 | #63 | Exceptional 8.2% |
| Immigrants | Kuwait | 99.9 /100 | #64 | Exceptional 8.3% |
| Immigrants | Albania | 99.9 /100 | #65 | Exceptional 8.3% |
| Luxembourgers | 99.9 /100 | #66 | Exceptional 8.3% |
| Armenians | 99.9 /100 | #67 | Exceptional 8.3% |
| Marshallese | 99.9 /100 | #68 | Exceptional 8.3% |
| Immigrants | Thailand | 99.9 /100 | #69 | Exceptional 8.3% |
| Norwegians | 99.9 /100 | #70 | Exceptional 8.3% |
| Immigrants | Australia | 99.8 /100 | #71 | Exceptional 8.3% |
| Immigrants | Nepal | 99.8 /100 | #72 | Exceptional 8.3% |
| Spanish Americans | 99.8 /100 | #73 | Exceptional 8.4% |
| Samoans | 99.7 /100 | #74 | Exceptional 8.4% |