Immigrants from Honduras vs Armenian Ambulatory Disability
COMPARE
Immigrants from Honduras
Armenian
Ambulatory Disability
Ambulatory Disability Comparison
Immigrants from Honduras
Armenians
6.3%
AMBULATORY DISABILITY
7.6/ 100
METRIC RATING
223rd/ 347
METRIC RANK
6.5%
AMBULATORY DISABILITY
1.5/ 100
METRIC RATING
246th/ 347
METRIC RANK
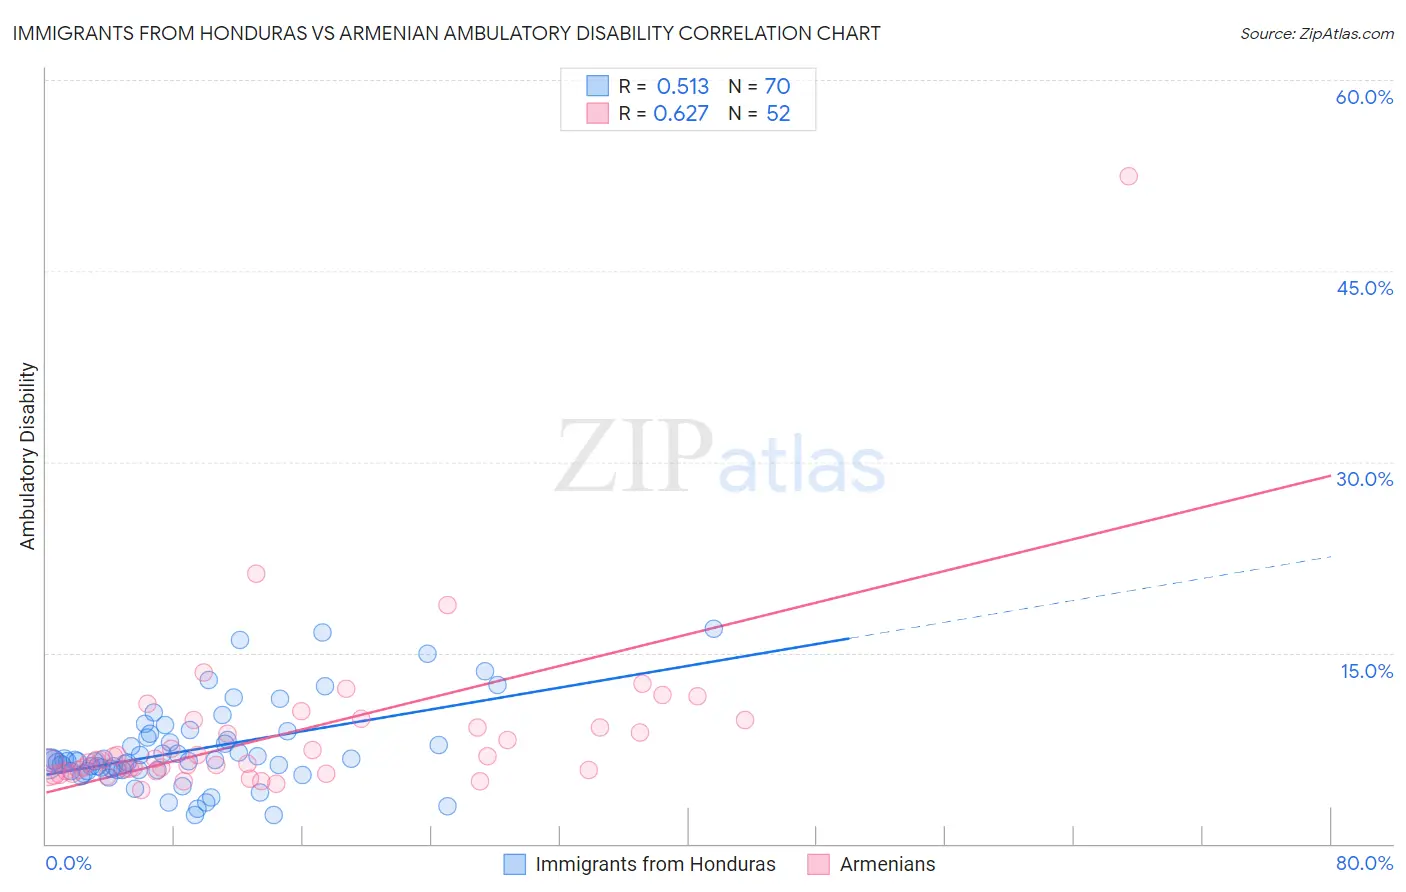
Immigrants from Honduras vs Armenian Ambulatory Disability Correlation Chart
The statistical analysis conducted on geographies consisting of 322,545,499 people shows a substantial positive correlation between the proportion of Immigrants from Honduras and percentage of population with ambulatory disability in the United States with a correlation coefficient (R) of 0.513 and weighted average of 6.3%. Similarly, the statistical analysis conducted on geographies consisting of 310,863,857 people shows a significant positive correlation between the proportion of Armenians and percentage of population with ambulatory disability in the United States with a correlation coefficient (R) of 0.627 and weighted average of 6.5%, a difference of 2.2%.
Ambulatory Disability Correlation Summary
| Measurement | Immigrants from Honduras | Armenian |
| Minimum | 2.2% | 4.2% |
| Maximum | 16.9% | 52.5% |
| Range | 14.6% | 48.3% |
| Mean | 7.4% | 8.7% |
| Median | 6.5% | 6.6% |
| Interquartile 25% (IQ1) | 5.8% | 5.7% |
| Interquartile 75% (IQ3) | 8.3% | 9.4% |
| Interquartile Range (IQR) | 2.6% | 3.7% |
| Standard Deviation (Sample) | 3.2% | 7.0% |
| Standard Deviation (Population) | 3.2% | 7.0% |
Similar Demographics by Ambulatory Disability
Demographics Similar to Immigrants from Honduras by Ambulatory Disability
In terms of ambulatory disability, the demographic groups most similar to Immigrants from Honduras are Liberian (6.3%, a difference of 0.10%), Honduran (6.3%, a difference of 0.27%), German Russian (6.3%, a difference of 0.29%), Hungarian (6.3%, a difference of 0.32%), and Immigrants from Albania (6.3%, a difference of 0.33%).
| Demographics | Rating | Rank | Ambulatory Disability |
| Canadians | 10.9 /100 | #216 | Poor 6.3% |
| Yugoslavians | 10.9 /100 | #217 | Poor 6.3% |
| Guamanians/Chamorros | 10.6 /100 | #218 | Poor 6.3% |
| Indonesians | 9.9 /100 | #219 | Tragic 6.3% |
| Immigrants | Albania | 9.6 /100 | #220 | Tragic 6.3% |
| Hungarians | 9.6 /100 | #221 | Tragic 6.3% |
| German Russians | 9.4 /100 | #222 | Tragic 6.3% |
| Immigrants | Honduras | 7.6 /100 | #223 | Tragic 6.3% |
| Liberians | 7.1 /100 | #224 | Tragic 6.3% |
| Hondurans | 6.3 /100 | #225 | Tragic 6.3% |
| Slavs | 5.1 /100 | #226 | Tragic 6.4% |
| Cubans | 4.0 /100 | #227 | Tragic 6.4% |
| Portuguese | 4.0 /100 | #228 | Tragic 6.4% |
| Czechoslovakians | 3.8 /100 | #229 | Tragic 6.4% |
| Mexicans | 3.5 /100 | #230 | Tragic 6.4% |
Demographics Similar to Armenians by Ambulatory Disability
In terms of ambulatory disability, the demographic groups most similar to Armenians are Tlingit-Haida (6.5%, a difference of 0.020%), German (6.5%, a difference of 0.050%), Immigrants from Panama (6.5%, a difference of 0.050%), Immigrants from Cuba (6.5%, a difference of 0.050%), and Spaniard (6.5%, a difference of 0.070%).
| Demographics | Rating | Rank | Ambulatory Disability |
| Senegalese | 1.7 /100 | #239 | Tragic 6.4% |
| Immigrants | Senegal | 1.7 /100 | #240 | Tragic 6.4% |
| Immigrants | Haiti | 1.6 /100 | #241 | Tragic 6.5% |
| Spaniards | 1.6 /100 | #242 | Tragic 6.5% |
| Germans | 1.5 /100 | #243 | Tragic 6.5% |
| Immigrants | Panama | 1.5 /100 | #244 | Tragic 6.5% |
| Tlingit-Haida | 1.5 /100 | #245 | Tragic 6.5% |
| Armenians | 1.5 /100 | #246 | Tragic 6.5% |
| Immigrants | Cuba | 1.4 /100 | #247 | Tragic 6.5% |
| Immigrants | Portugal | 1.4 /100 | #248 | Tragic 6.5% |
| Native Hawaiians | 1.1 /100 | #249 | Tragic 6.5% |
| Chinese | 1.0 /100 | #250 | Tragic 6.5% |
| Hawaiians | 0.9 /100 | #251 | Tragic 6.5% |
| Immigrants | Bahamas | 0.8 /100 | #252 | Tragic 6.5% |
| Scottish | 0.7 /100 | #253 | Tragic 6.5% |