Immigrants from Honduras vs Armenian Per Capita Income
COMPARE
Immigrants from Honduras
Armenian
Per Capita Income
Per Capita Income Comparison
Immigrants from Honduras
Armenians
$36,665
PER CAPITA INCOME
0.0/ 100
METRIC RATING
309th/ 347
METRIC RANK
$48,287
PER CAPITA INCOME
99.4/ 100
METRIC RATING
81st/ 347
METRIC RANK
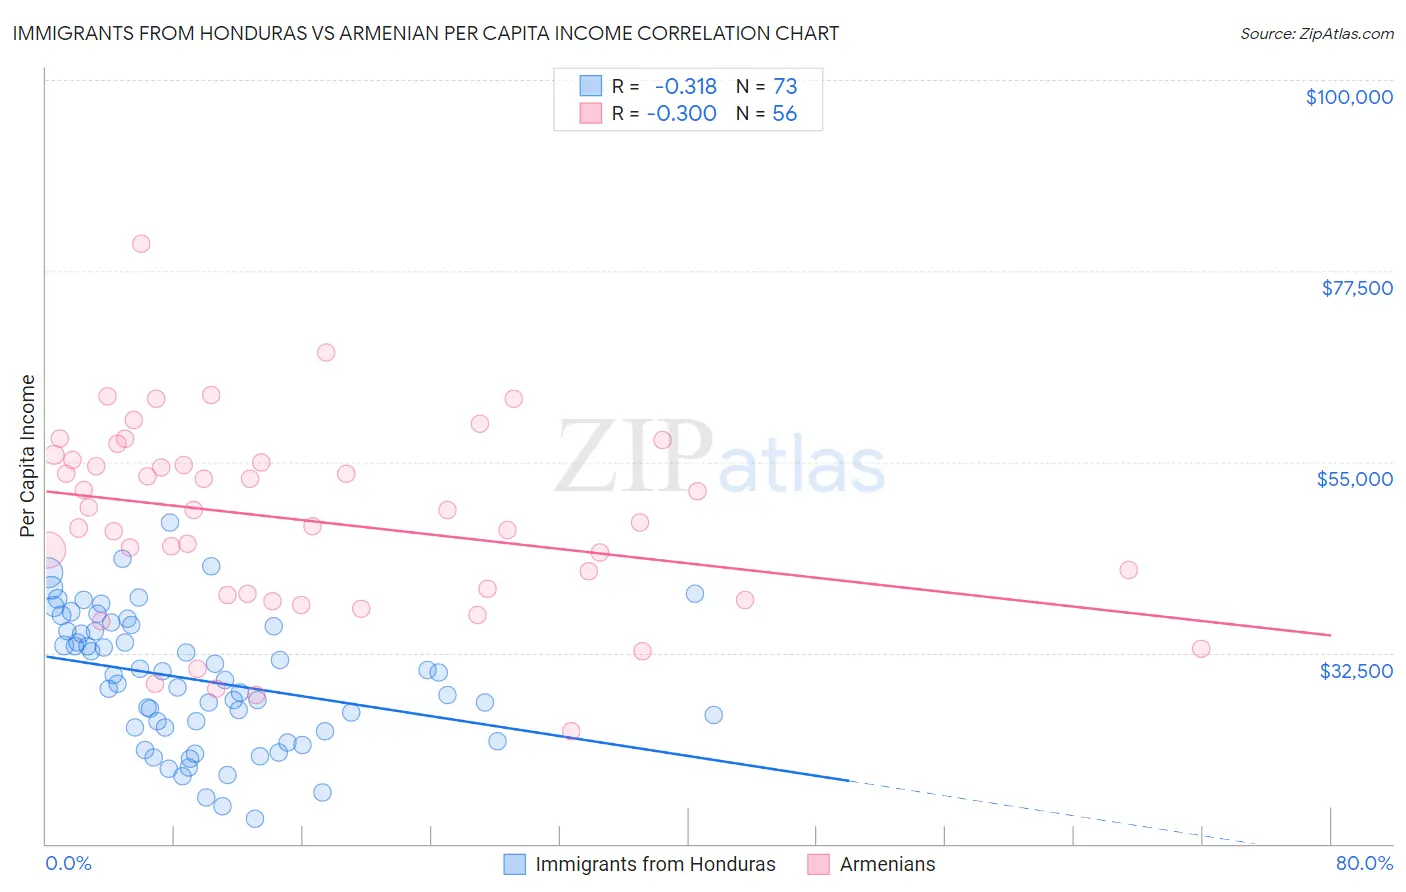
Immigrants from Honduras vs Armenian Per Capita Income Correlation Chart
The statistical analysis conducted on geographies consisting of 322,641,994 people shows a mild negative correlation between the proportion of Immigrants from Honduras and per capita income in the United States with a correlation coefficient (R) of -0.318 and weighted average of $36,665. Similarly, the statistical analysis conducted on geographies consisting of 310,965,464 people shows a mild negative correlation between the proportion of Armenians and per capita income in the United States with a correlation coefficient (R) of -0.300 and weighted average of $48,287, a difference of 31.7%.
Per Capita Income Correlation Summary
| Measurement | Immigrants from Honduras | Armenian |
| Minimum | $13,018 | $23,281 |
| Maximum | $47,908 | $80,691 |
| Range | $34,890 | $57,410 |
| Mean | $29,255 | $48,045 |
| Median | $29,272 | $48,616 |
| Interquartile 25% (IQ1) | $23,483 | $39,345 |
| Interquartile 75% (IQ3) | $35,344 | $55,100 |
| Interquartile Range (IQR) | $11,861 | $15,755 |
| Standard Deviation (Sample) | $7,769 | $11,238 |
| Standard Deviation (Population) | $7,715 | $11,138 |
Similar Demographics by Per Capita Income
Demographics Similar to Immigrants from Honduras by Per Capita Income
In terms of per capita income, the demographic groups most similar to Immigrants from Honduras are Ute ($36,651, a difference of 0.040%), Fijian ($36,690, a difference of 0.070%), Chippewa ($36,631, a difference of 0.090%), Immigrants from Latin America ($36,823, a difference of 0.43%), and Immigrants from Haiti ($36,849, a difference of 0.50%).
| Demographics | Rating | Rank | Per Capita Income |
| Shoshone | 0.1 /100 | #302 | Tragic $37,072 |
| Paiute | 0.1 /100 | #303 | Tragic $37,066 |
| Hondurans | 0.1 /100 | #304 | Tragic $37,031 |
| Inupiat | 0.1 /100 | #305 | Tragic $36,999 |
| Immigrants | Haiti | 0.0 /100 | #306 | Tragic $36,849 |
| Immigrants | Latin America | 0.0 /100 | #307 | Tragic $36,823 |
| Fijians | 0.0 /100 | #308 | Tragic $36,690 |
| Immigrants | Honduras | 0.0 /100 | #309 | Tragic $36,665 |
| Ute | 0.0 /100 | #310 | Tragic $36,651 |
| Chippewa | 0.0 /100 | #311 | Tragic $36,631 |
| Chickasaw | 0.0 /100 | #312 | Tragic $36,475 |
| Bahamians | 0.0 /100 | #313 | Tragic $36,427 |
| Seminole | 0.0 /100 | #314 | Tragic $36,180 |
| Yaqui | 0.0 /100 | #315 | Tragic $36,112 |
| Choctaw | 0.0 /100 | #316 | Tragic $35,999 |
Demographics Similar to Armenians by Per Capita Income
In terms of per capita income, the demographic groups most similar to Armenians are Egyptian ($48,358, a difference of 0.15%), Immigrants from Indonesia ($48,195, a difference of 0.19%), Immigrants from Brazil ($48,164, a difference of 0.26%), Immigrants from Ukraine ($48,134, a difference of 0.32%), and Romanian ($48,445, a difference of 0.33%).
| Demographics | Rating | Rank | Per Capita Income |
| Mongolians | 99.8 /100 | #74 | Exceptional $49,173 |
| Immigrants | Bolivia | 99.7 /100 | #75 | Exceptional $48,970 |
| Immigrants | England | 99.7 /100 | #76 | Exceptional $48,844 |
| Immigrants | Kazakhstan | 99.7 /100 | #77 | Exceptional $48,747 |
| Immigrants | Italy | 99.6 /100 | #78 | Exceptional $48,654 |
| Romanians | 99.5 /100 | #79 | Exceptional $48,445 |
| Egyptians | 99.5 /100 | #80 | Exceptional $48,358 |
| Armenians | 99.4 /100 | #81 | Exceptional $48,287 |
| Immigrants | Indonesia | 99.4 /100 | #82 | Exceptional $48,195 |
| Immigrants | Brazil | 99.4 /100 | #83 | Exceptional $48,164 |
| Immigrants | Ukraine | 99.3 /100 | #84 | Exceptional $48,134 |
| Austrians | 99.3 /100 | #85 | Exceptional $48,116 |
| Immigrants | Southern Europe | 99.3 /100 | #86 | Exceptional $48,027 |
| Ukrainians | 99.3 /100 | #87 | Exceptional $48,014 |
| Croatians | 99.0 /100 | #88 | Exceptional $47,742 |