Immigrants from Honduras vs Chinese Unemployment Among Women with Children Ages 6 to 17 years
COMPARE
Immigrants from Honduras
Chinese
Unemployment Among Women with Children Ages 6 to 17 years
Unemployment Among Women with Children Ages 6 to 17 years Comparison
Immigrants from Honduras
Chinese
10.1%
UNEMPLOYMENT AMONG WOMEN WITH CHILDREN AGES 6 TO 17 YEARS
0.0/ 100
METRIC RATING
299th/ 347
METRIC RANK
9.3%
UNEMPLOYMENT AMONG WOMEN WITH CHILDREN AGES 6 TO 17 YEARS
5.2/ 100
METRIC RATING
225th/ 347
METRIC RANK
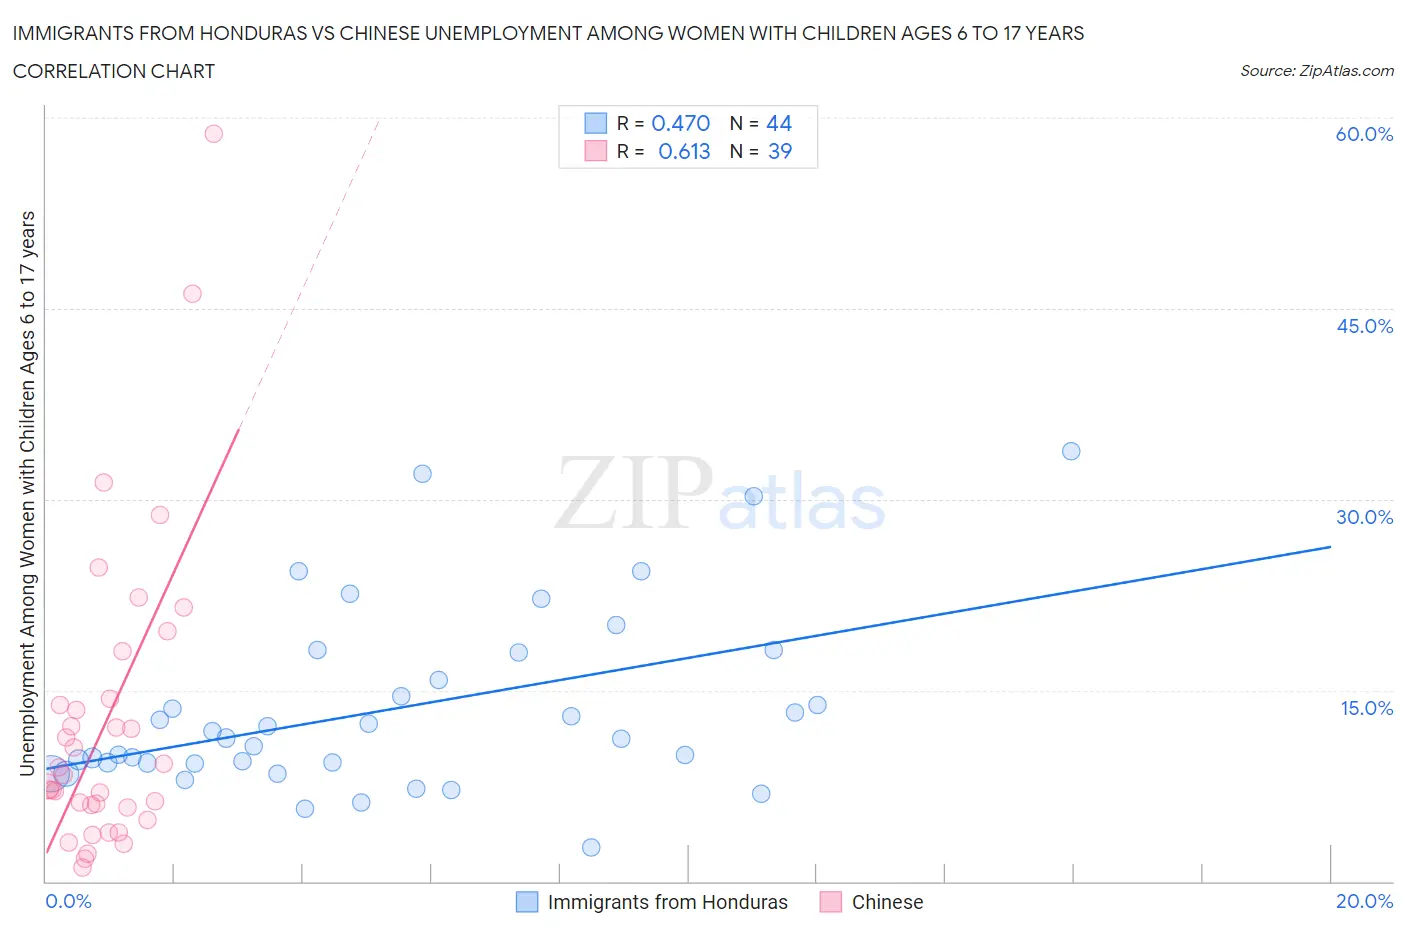
Immigrants from Honduras vs Chinese Unemployment Among Women with Children Ages 6 to 17 years Correlation Chart
The statistical analysis conducted on geographies consisting of 250,516,904 people shows a moderate positive correlation between the proportion of Immigrants from Honduras and unemployment rate among women with children between the ages 6 and 17 in the United States with a correlation coefficient (R) of 0.470 and weighted average of 10.1%. Similarly, the statistical analysis conducted on geographies consisting of 57,778,036 people shows a significant positive correlation between the proportion of Chinese and unemployment rate among women with children between the ages 6 and 17 in the United States with a correlation coefficient (R) of 0.613 and weighted average of 9.3%, a difference of 9.1%.
Unemployment Among Women with Children Ages 6 to 17 years Correlation Summary
| Measurement | Immigrants from Honduras | Chinese |
| Minimum | 2.7% | 1.1% |
| Maximum | 33.8% | 58.7% |
| Range | 31.1% | 57.6% |
| Mean | 13.5% | 12.6% |
| Median | 11.2% | 8.3% |
| Interquartile 25% (IQ1) | 9.3% | 5.8% |
| Interquartile 75% (IQ3) | 16.9% | 14.3% |
| Interquartile Range (IQR) | 7.6% | 8.5% |
| Standard Deviation (Sample) | 7.1% | 12.1% |
| Standard Deviation (Population) | 7.0% | 11.9% |
Similar Demographics by Unemployment Among Women with Children Ages 6 to 17 years
Demographics Similar to Immigrants from Honduras by Unemployment Among Women with Children Ages 6 to 17 years
In terms of unemployment among women with children ages 6 to 17 years, the demographic groups most similar to Immigrants from Honduras are Immigrants from Haiti (10.1%, a difference of 0.020%), Nigerian (10.1%, a difference of 0.020%), Immigrants from Bahamas (10.1%, a difference of 0.18%), Immigrants from Caribbean (10.1%, a difference of 0.32%), and Immigrants from Western Africa (10.1%, a difference of 0.34%).
| Demographics | Rating | Rank | Unemployment Among Women with Children Ages 6 to 17 years |
| Carpatho Rusyns | 0.0 /100 | #292 | Tragic 10.0% |
| Haitians | 0.0 /100 | #293 | Tragic 10.0% |
| Ecuadorians | 0.0 /100 | #294 | Tragic 10.0% |
| Cherokee | 0.0 /100 | #295 | Tragic 10.0% |
| Immigrants | Western Africa | 0.0 /100 | #296 | Tragic 10.1% |
| Immigrants | Caribbean | 0.0 /100 | #297 | Tragic 10.1% |
| Immigrants | Haiti | 0.0 /100 | #298 | Tragic 10.1% |
| Immigrants | Honduras | 0.0 /100 | #299 | Tragic 10.1% |
| Nigerians | 0.0 /100 | #300 | Tragic 10.1% |
| Immigrants | Bahamas | 0.0 /100 | #301 | Tragic 10.1% |
| Venezuelans | 0.0 /100 | #302 | Tragic 10.2% |
| Immigrants | Ecuador | 0.0 /100 | #303 | Tragic 10.2% |
| Immigrants | Venezuela | 0.0 /100 | #304 | Tragic 10.2% |
| Immigrants | Nigeria | 0.0 /100 | #305 | Tragic 10.2% |
| Paraguayans | 0.0 /100 | #306 | Tragic 10.2% |
Demographics Similar to Chinese by Unemployment Among Women with Children Ages 6 to 17 years
In terms of unemployment among women with children ages 6 to 17 years, the demographic groups most similar to Chinese are Immigrants from El Salvador (9.3%, a difference of 0.010%), Immigrants from Eritrea (9.2%, a difference of 0.11%), Immigrants from Southern Europe (9.2%, a difference of 0.12%), Crow (9.2%, a difference of 0.13%), and Immigrants from the Azores (9.3%, a difference of 0.14%).
| Demographics | Rating | Rank | Unemployment Among Women with Children Ages 6 to 17 years |
| Syrians | 6.9 /100 | #218 | Tragic 9.2% |
| Immigrants | Scotland | 6.6 /100 | #219 | Tragic 9.2% |
| Belgians | 6.4 /100 | #220 | Tragic 9.2% |
| Crow | 5.8 /100 | #221 | Tragic 9.2% |
| Immigrants | Southern Europe | 5.8 /100 | #222 | Tragic 9.2% |
| Immigrants | Eritrea | 5.8 /100 | #223 | Tragic 9.2% |
| Immigrants | El Salvador | 5.3 /100 | #224 | Tragic 9.3% |
| Chinese | 5.2 /100 | #225 | Tragic 9.3% |
| Immigrants | Azores | 4.6 /100 | #226 | Tragic 9.3% |
| Panamanians | 4.5 /100 | #227 | Tragic 9.3% |
| Estonians | 4.4 /100 | #228 | Tragic 9.3% |
| Lumbee | 4.3 /100 | #229 | Tragic 9.3% |
| Welsh | 4.0 /100 | #230 | Tragic 9.3% |
| Macedonians | 3.9 /100 | #231 | Tragic 9.3% |
| French American Indians | 3.7 /100 | #232 | Tragic 9.3% |