Immigrants from Honduras vs Armenian Professional Degree
COMPARE
Immigrants from Honduras
Armenian
Professional Degree
Professional Degree Comparison
Immigrants from Honduras
Armenians
3.5%
PROFESSIONAL DEGREE
0.3/ 100
METRIC RATING
293rd/ 347
METRIC RANK
5.3%
PROFESSIONAL DEGREE
99.7/ 100
METRIC RATING
78th/ 347
METRIC RANK
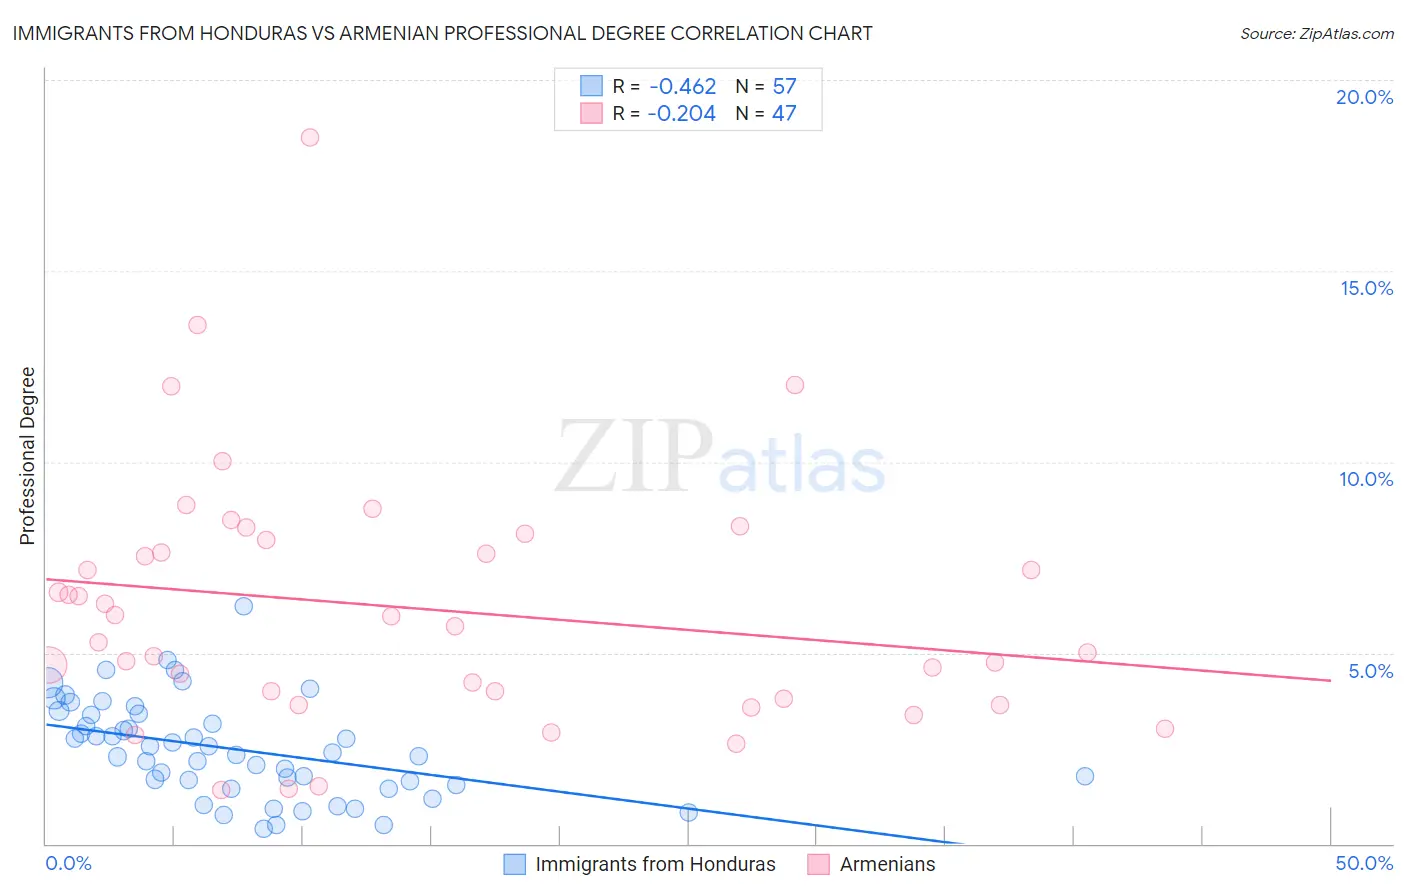
Immigrants from Honduras vs Armenian Professional Degree Correlation Chart
The statistical analysis conducted on geographies consisting of 321,705,777 people shows a moderate negative correlation between the proportion of Immigrants from Honduras and percentage of population with at least professional degree education in the United States with a correlation coefficient (R) of -0.462 and weighted average of 3.5%. Similarly, the statistical analysis conducted on geographies consisting of 310,624,629 people shows a weak negative correlation between the proportion of Armenians and percentage of population with at least professional degree education in the United States with a correlation coefficient (R) of -0.204 and weighted average of 5.3%, a difference of 54.7%.
Professional Degree Correlation Summary
| Measurement | Immigrants from Honduras | Armenian |
| Minimum | 0.38% | 1.4% |
| Maximum | 6.2% | 18.5% |
| Range | 5.8% | 17.1% |
| Mean | 2.5% | 6.2% |
| Median | 2.4% | 5.7% |
| Interquartile 25% (IQ1) | 1.6% | 3.8% |
| Interquartile 75% (IQ3) | 3.4% | 8.0% |
| Interquartile Range (IQR) | 1.8% | 4.1% |
| Standard Deviation (Sample) | 1.3% | 3.3% |
| Standard Deviation (Population) | 1.2% | 3.3% |
Similar Demographics by Professional Degree
Demographics Similar to Immigrants from Honduras by Professional Degree
In terms of professional degree, the demographic groups most similar to Immigrants from Honduras are Paiute (3.4%, a difference of 0.080%), Immigrants from Belize (3.5%, a difference of 0.24%), Immigrants from Guatemala (3.4%, a difference of 0.24%), Hawaiian (3.4%, a difference of 0.25%), and Alaska Native (3.5%, a difference of 0.30%).
| Demographics | Rating | Rank | Professional Degree |
| Haitians | 0.3 /100 | #286 | Tragic 3.5% |
| Immigrants | El Salvador | 0.3 /100 | #287 | Tragic 3.5% |
| Blackfeet | 0.3 /100 | #288 | Tragic 3.5% |
| Guatemalans | 0.3 /100 | #289 | Tragic 3.5% |
| Chippewa | 0.3 /100 | #290 | Tragic 3.5% |
| Alaska Natives | 0.3 /100 | #291 | Tragic 3.5% |
| Immigrants | Belize | 0.3 /100 | #292 | Tragic 3.5% |
| Immigrants | Honduras | 0.3 /100 | #293 | Tragic 3.5% |
| Paiute | 0.3 /100 | #294 | Tragic 3.4% |
| Immigrants | Guatemala | 0.2 /100 | #295 | Tragic 3.4% |
| Hawaiians | 0.2 /100 | #296 | Tragic 3.4% |
| Immigrants | Liberia | 0.2 /100 | #297 | Tragic 3.4% |
| Ottawa | 0.2 /100 | #298 | Tragic 3.4% |
| Immigrants | Yemen | 0.2 /100 | #299 | Tragic 3.4% |
| Blacks/African Americans | 0.2 /100 | #300 | Tragic 3.4% |
Demographics Similar to Armenians by Professional Degree
In terms of professional degree, the demographic groups most similar to Armenians are Immigrants from Ethiopia (5.3%, a difference of 0.050%), Immigrants from Canada (5.3%, a difference of 0.090%), Immigrants from Indonesia (5.3%, a difference of 0.17%), Immigrants from North America (5.3%, a difference of 0.17%), and Ethiopian (5.4%, a difference of 0.30%).
| Demographics | Rating | Rank | Professional Degree |
| Immigrants | Western Asia | 99.8 /100 | #71 | Exceptional 5.4% |
| Lithuanians | 99.8 /100 | #72 | Exceptional 5.4% |
| Immigrants | Romania | 99.8 /100 | #73 | Exceptional 5.4% |
| Ethiopians | 99.7 /100 | #74 | Exceptional 5.4% |
| Immigrants | Indonesia | 99.7 /100 | #75 | Exceptional 5.3% |
| Immigrants | Canada | 99.7 /100 | #76 | Exceptional 5.3% |
| Immigrants | Ethiopia | 99.7 /100 | #77 | Exceptional 5.3% |
| Armenians | 99.7 /100 | #78 | Exceptional 5.3% |
| Immigrants | North America | 99.7 /100 | #79 | Exceptional 5.3% |
| Immigrants | England | 99.6 /100 | #80 | Exceptional 5.3% |
| Immigrants | Brazil | 99.6 /100 | #81 | Exceptional 5.3% |
| Romanians | 99.6 /100 | #82 | Exceptional 5.3% |
| Carpatho Rusyns | 99.6 /100 | #83 | Exceptional 5.3% |
| Immigrants | Croatia | 99.6 /100 | #84 | Exceptional 5.3% |
| Immigrants | Zimbabwe | 99.6 /100 | #85 | Exceptional 5.3% |