U.S. Virgin Islander vs Armenian Unemployment Among Women with Children Ages 6 to 17 years
COMPARE
U.S. Virgin Islander
Armenian
Unemployment Among Women with Children Ages 6 to 17 years
Unemployment Among Women with Children Ages 6 to 17 years Comparison
U.S. Virgin Islanders
Armenians
9.7%
UNEMPLOYMENT AMONG WOMEN WITH CHILDREN AGES 6 TO 17 YEARS
0.1/ 100
METRIC RATING
275th/ 347
METRIC RANK
8.3%
UNEMPLOYMENT AMONG WOMEN WITH CHILDREN AGES 6 TO 17 YEARS
99.9/ 100
METRIC RATING
67th/ 347
METRIC RANK
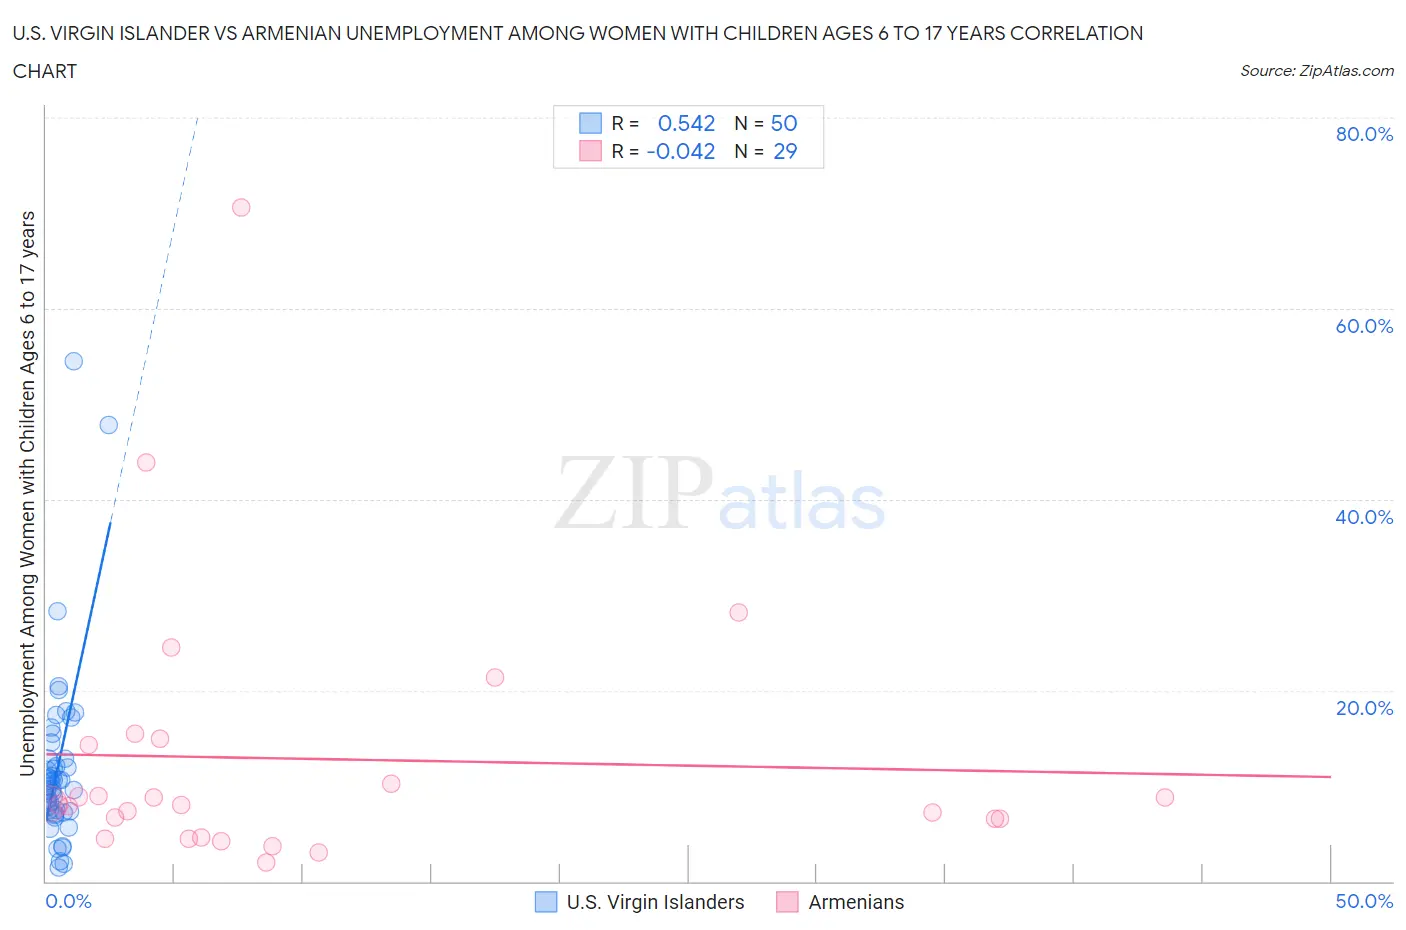
U.S. Virgin Islander vs Armenian Unemployment Among Women with Children Ages 6 to 17 years Correlation Chart
The statistical analysis conducted on geographies consisting of 79,674,209 people shows a substantial positive correlation between the proportion of U.S. Virgin Islanders and unemployment rate among women with children between the ages 6 and 17 in the United States with a correlation coefficient (R) of 0.542 and weighted average of 9.7%. Similarly, the statistical analysis conducted on geographies consisting of 229,483,477 people shows no correlation between the proportion of Armenians and unemployment rate among women with children between the ages 6 and 17 in the United States with a correlation coefficient (R) of -0.042 and weighted average of 8.3%, a difference of 16.7%.
Unemployment Among Women with Children Ages 6 to 17 years Correlation Summary
| Measurement | U.S. Virgin Islander | Armenian |
| Minimum | 1.4% | 1.9% |
| Maximum | 54.5% | 70.6% |
| Range | 53.1% | 68.7% |
| Mean | 12.1% | 12.8% |
| Median | 10.2% | 8.0% |
| Interquartile 25% (IQ1) | 7.3% | 5.6% |
| Interquartile 75% (IQ3) | 12.8% | 14.6% |
| Interquartile Range (IQR) | 5.5% | 9.0% |
| Standard Deviation (Sample) | 9.6% | 14.2% |
| Standard Deviation (Population) | 9.5% | 14.0% |
Similar Demographics by Unemployment Among Women with Children Ages 6 to 17 years
Demographics Similar to U.S. Virgin Islanders by Unemployment Among Women with Children Ages 6 to 17 years
In terms of unemployment among women with children ages 6 to 17 years, the demographic groups most similar to U.S. Virgin Islanders are Immigrants from Portugal (9.7%, a difference of 0.010%), British West Indian (9.7%, a difference of 0.060%), French (9.7%, a difference of 0.13%), Scotch-Irish (9.7%, a difference of 0.17%), and Seminole (9.7%, a difference of 0.36%).
| Demographics | Rating | Rank | Unemployment Among Women with Children Ages 6 to 17 years |
| Ghanaians | 0.2 /100 | #268 | Tragic 9.6% |
| Blackfeet | 0.2 /100 | #269 | Tragic 9.6% |
| Immigrants | Nicaragua | 0.2 /100 | #270 | Tragic 9.6% |
| Immigrants | Latin America | 0.1 /100 | #271 | Tragic 9.6% |
| Kiowa | 0.1 /100 | #272 | Tragic 9.6% |
| Whites/Caucasians | 0.1 /100 | #273 | Tragic 9.6% |
| Aleuts | 0.1 /100 | #274 | Tragic 9.6% |
| U.S. Virgin Islanders | 0.1 /100 | #275 | Tragic 9.7% |
| Immigrants | Portugal | 0.1 /100 | #276 | Tragic 9.7% |
| British West Indians | 0.1 /100 | #277 | Tragic 9.7% |
| French | 0.1 /100 | #278 | Tragic 9.7% |
| Scotch-Irish | 0.1 /100 | #279 | Tragic 9.7% |
| Seminole | 0.1 /100 | #280 | Tragic 9.7% |
| Jamaicans | 0.0 /100 | #281 | Tragic 9.8% |
| Slovaks | 0.0 /100 | #282 | Tragic 9.8% |
Demographics Similar to Armenians by Unemployment Among Women with Children Ages 6 to 17 years
In terms of unemployment among women with children ages 6 to 17 years, the demographic groups most similar to Armenians are Marshallese (8.3%, a difference of 0.080%), Luxembourger (8.3%, a difference of 0.10%), Immigrants from Thailand (8.3%, a difference of 0.11%), Norwegian (8.3%, a difference of 0.19%), and Immigrants from Albania (8.3%, a difference of 0.23%).
| Demographics | Rating | Rank | Unemployment Among Women with Children Ages 6 to 17 years |
| Basques | 100.0 /100 | #60 | Exceptional 8.2% |
| Koreans | 100.0 /100 | #61 | Exceptional 8.2% |
| Spanish American Indians | 100.0 /100 | #62 | Exceptional 8.2% |
| Immigrants | South Eastern Asia | 99.9 /100 | #63 | Exceptional 8.2% |
| Immigrants | Kuwait | 99.9 /100 | #64 | Exceptional 8.3% |
| Immigrants | Albania | 99.9 /100 | #65 | Exceptional 8.3% |
| Luxembourgers | 99.9 /100 | #66 | Exceptional 8.3% |
| Armenians | 99.9 /100 | #67 | Exceptional 8.3% |
| Marshallese | 99.9 /100 | #68 | Exceptional 8.3% |
| Immigrants | Thailand | 99.9 /100 | #69 | Exceptional 8.3% |
| Norwegians | 99.9 /100 | #70 | Exceptional 8.3% |
| Immigrants | Australia | 99.8 /100 | #71 | Exceptional 8.3% |
| Immigrants | Nepal | 99.8 /100 | #72 | Exceptional 8.3% |
| Spanish Americans | 99.8 /100 | #73 | Exceptional 8.4% |
| Samoans | 99.7 /100 | #74 | Exceptional 8.4% |