Immigrants from Guyana vs Arab Male Unemployment
COMPARE
Immigrants from Guyana
Arab
Male Unemployment
Male Unemployment Comparison
Immigrants from Guyana
Arabs
7.1%
MALE UNEMPLOYMENT
0.0/ 100
METRIC RATING
316th/ 347
METRIC RANK
5.4%
MALE UNEMPLOYMENT
30.2/ 100
METRIC RATING
188th/ 347
METRIC RANK
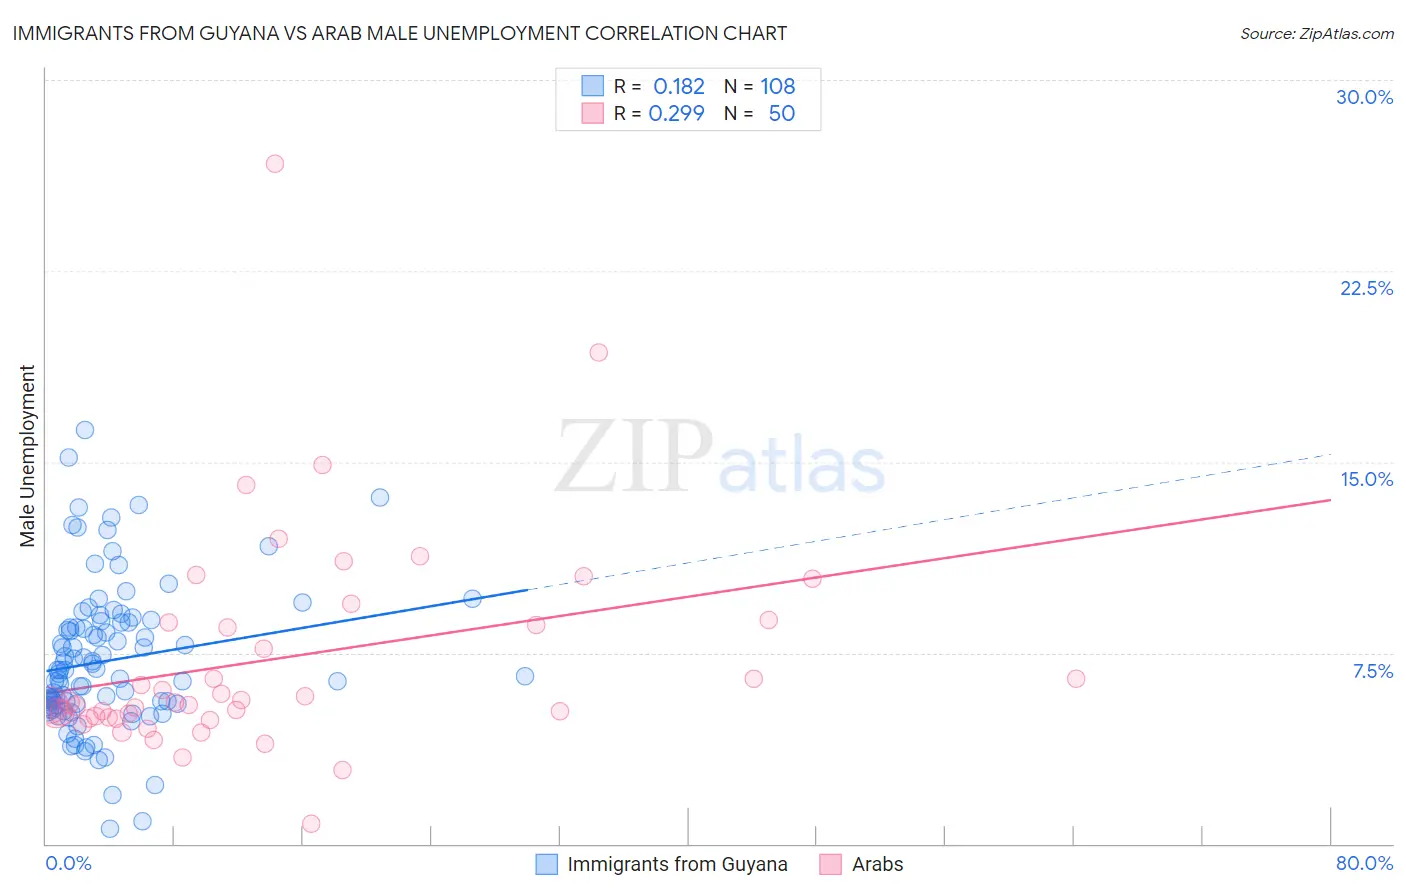
Immigrants from Guyana vs Arab Male Unemployment Correlation Chart
The statistical analysis conducted on geographies consisting of 183,427,886 people shows a poor positive correlation between the proportion of Immigrants from Guyana and unemployment rate among males in the United States with a correlation coefficient (R) of 0.182 and weighted average of 7.1%. Similarly, the statistical analysis conducted on geographies consisting of 483,718,645 people shows a weak positive correlation between the proportion of Arabs and unemployment rate among males in the United States with a correlation coefficient (R) of 0.299 and weighted average of 5.4%, a difference of 32.7%.
Male Unemployment Correlation Summary
| Measurement | Immigrants from Guyana | Arab |
| Minimum | 0.60% | 0.80% |
| Maximum | 16.2% | 26.7% |
| Range | 15.6% | 25.9% |
| Mean | 7.2% | 7.3% |
| Median | 6.7% | 5.5% |
| Interquartile 25% (IQ1) | 5.4% | 4.9% |
| Interquartile 75% (IQ3) | 8.7% | 8.7% |
| Interquartile Range (IQR) | 3.3% | 3.7% |
| Standard Deviation (Sample) | 2.8% | 4.4% |
| Standard Deviation (Population) | 2.8% | 4.3% |
Similar Demographics by Male Unemployment
Demographics Similar to Immigrants from Guyana by Male Unemployment
In terms of male unemployment, the demographic groups most similar to Immigrants from Guyana are Houma (7.1%, a difference of 0.030%), Guyanese (7.1%, a difference of 0.060%), Cape Verdean (7.1%, a difference of 0.12%), Immigrants from Barbados (7.1%, a difference of 0.24%), and Immigrants from Dominica (7.0%, a difference of 1.5%).
| Demographics | Rating | Rank | Male Unemployment |
| Barbadians | 0.0 /100 | #309 | Tragic 6.9% |
| Blacks/African Americans | 0.0 /100 | #310 | Tragic 6.9% |
| Immigrants | Armenia | 0.0 /100 | #311 | Tragic 6.9% |
| Lumbee | 0.0 /100 | #312 | Tragic 6.9% |
| Immigrants | Dominica | 0.0 /100 | #313 | Tragic 7.0% |
| Immigrants | Barbados | 0.0 /100 | #314 | Tragic 7.1% |
| Houma | 0.0 /100 | #315 | Tragic 7.1% |
| Immigrants | Guyana | 0.0 /100 | #316 | Tragic 7.1% |
| Guyanese | 0.0 /100 | #317 | Tragic 7.1% |
| Cape Verdeans | 0.0 /100 | #318 | Tragic 7.1% |
| British West Indians | 0.0 /100 | #319 | Tragic 7.3% |
| Colville | 0.0 /100 | #320 | Tragic 7.4% |
| Immigrants | St. Vincent and the Grenadines | 0.0 /100 | #321 | Tragic 7.5% |
| Immigrants | Cabo Verde | 0.0 /100 | #322 | Tragic 7.5% |
| Immigrants | Grenada | 0.0 /100 | #323 | Tragic 7.6% |
Demographics Similar to Arabs by Male Unemployment
In terms of male unemployment, the demographic groups most similar to Arabs are Immigrants from South America (5.4%, a difference of 0.060%), Costa Rican (5.4%, a difference of 0.080%), Iraqi (5.4%, a difference of 0.090%), Immigrants from Uganda (5.4%, a difference of 0.10%), and Immigrants from South Eastern Asia (5.4%, a difference of 0.14%).
| Demographics | Rating | Rank | Male Unemployment |
| Immigrants | Afghanistan | 37.9 /100 | #181 | Fair 5.3% |
| Potawatomi | 37.8 /100 | #182 | Fair 5.3% |
| Taiwanese | 37.6 /100 | #183 | Fair 5.3% |
| Spaniards | 35.1 /100 | #184 | Fair 5.3% |
| Koreans | 34.9 /100 | #185 | Fair 5.3% |
| Iraqis | 31.6 /100 | #186 | Fair 5.4% |
| Costa Ricans | 31.3 /100 | #187 | Fair 5.4% |
| Arabs | 30.2 /100 | #188 | Fair 5.4% |
| Immigrants | South America | 29.4 /100 | #189 | Fair 5.4% |
| Immigrants | Uganda | 28.8 /100 | #190 | Fair 5.4% |
| Immigrants | South Eastern Asia | 28.2 /100 | #191 | Fair 5.4% |
| Immigrants | Belarus | 26.0 /100 | #192 | Fair 5.4% |
| Immigrants | Israel | 25.2 /100 | #193 | Fair 5.4% |
| Spanish | 19.7 /100 | #194 | Poor 5.4% |
| Immigrants | Southern Europe | 17.7 /100 | #195 | Poor 5.4% |