Immigrants from Guyana vs Apache 1 or more Vehicles in Household
COMPARE
Immigrants from Guyana
Apache
1 or more Vehicles in Household
1 or more Vehicles in Household Comparison
Immigrants from Guyana
Apache
70.6%
1 OR MORE VEHICLES IN HOUSEHOLD
0.0/ 100
METRIC RATING
342nd/ 347
METRIC RANK
89.1%
1 OR MORE VEHICLES IN HOUSEHOLD
16.2/ 100
METRIC RATING
206th/ 347
METRIC RANK
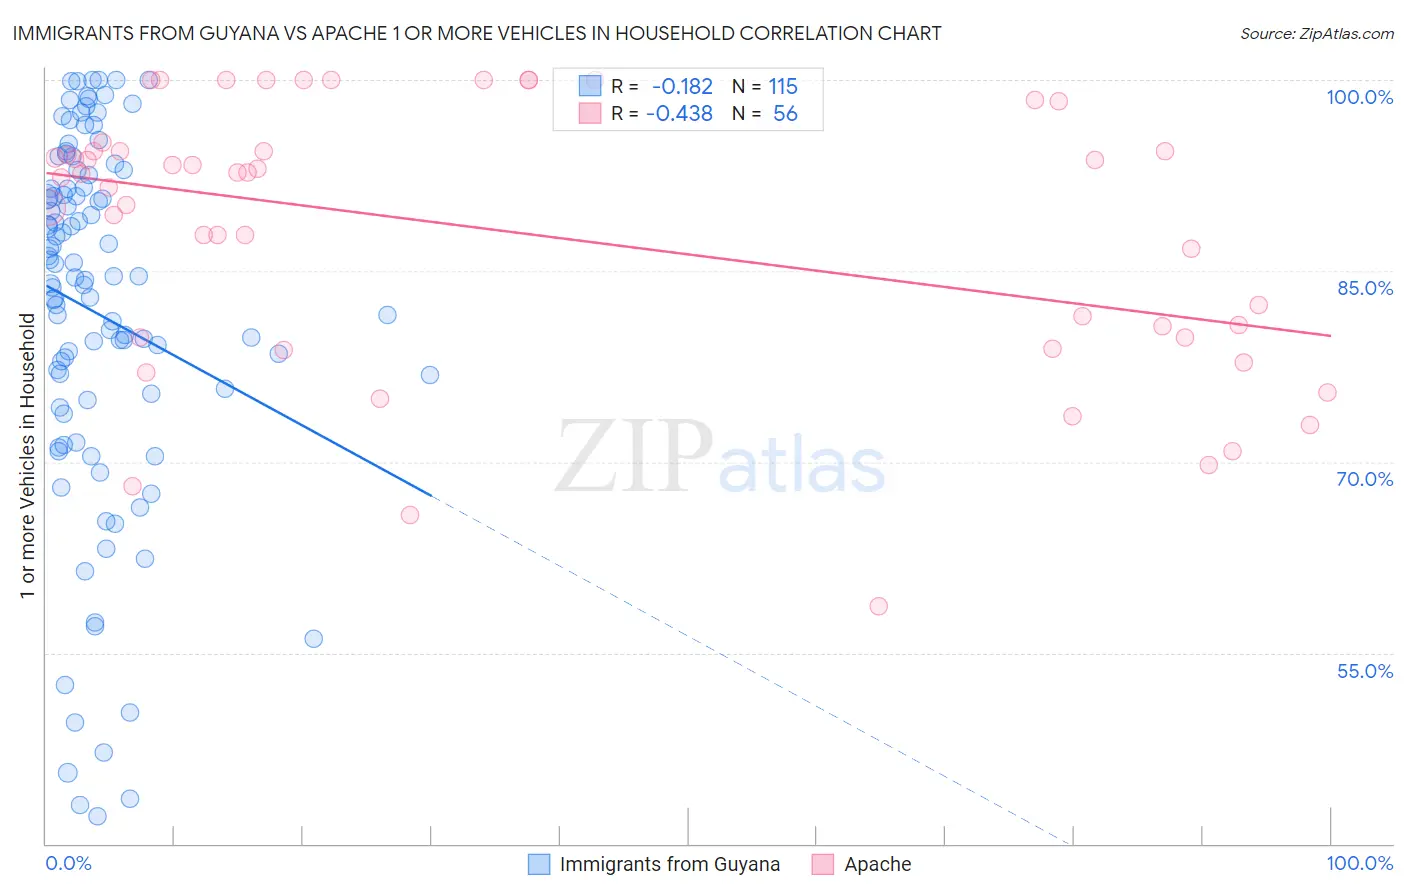
Immigrants from Guyana vs Apache 1 or more Vehicles in Household Correlation Chart
The statistical analysis conducted on geographies consisting of 183,508,680 people shows a poor negative correlation between the proportion of Immigrants from Guyana and percentage of households with 1 or more vehicles available in the United States with a correlation coefficient (R) of -0.182 and weighted average of 70.6%. Similarly, the statistical analysis conducted on geographies consisting of 231,048,129 people shows a moderate negative correlation between the proportion of Apache and percentage of households with 1 or more vehicles available in the United States with a correlation coefficient (R) of -0.438 and weighted average of 89.1%, a difference of 26.3%.
1 or more Vehicles in Household Correlation Summary
| Measurement | Immigrants from Guyana | Apache |
| Minimum | 42.2% | 58.7% |
| Maximum | 100.0% | 100.0% |
| Range | 57.8% | 41.3% |
| Mean | 81.7% | 88.0% |
| Median | 84.4% | 92.5% |
| Interquartile 25% (IQ1) | 74.9% | 79.8% |
| Interquartile 75% (IQ3) | 91.6% | 94.4% |
| Interquartile Range (IQR) | 16.7% | 14.6% |
| Standard Deviation (Sample) | 14.3% | 10.5% |
| Standard Deviation (Population) | 14.3% | 10.4% |
Similar Demographics by 1 or more Vehicles in Household
Demographics Similar to Immigrants from Guyana by 1 or more Vehicles in Household
In terms of 1 or more vehicles in household, the demographic groups most similar to Immigrants from Guyana are Immigrants from Barbados (70.6%, a difference of 0.010%), Dominican (70.7%, a difference of 0.15%), British West Indian (70.4%, a difference of 0.31%), Guyanese (70.8%, a difference of 0.34%), and Inupiat (71.5%, a difference of 1.4%).
| Demographics | Rating | Rank | 1 or more Vehicles in Household |
| Immigrants | Ecuador | 0.0 /100 | #333 | Tragic 76.2% |
| Immigrants | Bangladesh | 0.0 /100 | #334 | Tragic 74.3% |
| Barbadians | 0.0 /100 | #335 | Tragic 74.0% |
| Vietnamese | 0.0 /100 | #336 | Tragic 73.8% |
| Immigrants | Uzbekistan | 0.0 /100 | #337 | Tragic 73.4% |
| Inupiat | 0.0 /100 | #338 | Tragic 71.5% |
| Guyanese | 0.0 /100 | #339 | Tragic 70.8% |
| Dominicans | 0.0 /100 | #340 | Tragic 70.7% |
| Immigrants | Barbados | 0.0 /100 | #341 | Tragic 70.6% |
| Immigrants | Guyana | 0.0 /100 | #342 | Tragic 70.6% |
| British West Indians | 0.0 /100 | #343 | Tragic 70.4% |
| Immigrants | Dominican Republic | 0.0 /100 | #344 | Tragic 68.6% |
| Immigrants | St. Vincent and the Grenadines | 0.0 /100 | #345 | Tragic 64.7% |
| Immigrants | Grenada | 0.0 /100 | #346 | Tragic 62.7% |
| Yup'ik | 0.0 /100 | #347 | Tragic 58.4% |
Demographics Similar to Apache by 1 or more Vehicles in Household
In terms of 1 or more vehicles in household, the demographic groups most similar to Apache are Immigrants from Denmark (89.1%, a difference of 0.040%), Guatemalan (89.2%, a difference of 0.050%), Immigrants from Chile (89.1%, a difference of 0.050%), Romanian (89.2%, a difference of 0.060%), and Immigrants from Italy (89.1%, a difference of 0.070%).
| Demographics | Rating | Rank | 1 or more Vehicles in Household |
| Immigrants | Asia | 22.8 /100 | #199 | Fair 89.3% |
| Central Americans | 21.4 /100 | #200 | Fair 89.2% |
| Immigrants | Western Europe | 20.5 /100 | #201 | Fair 89.2% |
| Iroquois | 19.8 /100 | #202 | Poor 89.2% |
| Cambodians | 18.9 /100 | #203 | Poor 89.2% |
| Romanians | 18.2 /100 | #204 | Poor 89.2% |
| Guatemalans | 17.8 /100 | #205 | Poor 89.2% |
| Apache | 16.2 /100 | #206 | Poor 89.1% |
| Immigrants | Denmark | 14.8 /100 | #207 | Poor 89.1% |
| Immigrants | Chile | 14.4 /100 | #208 | Poor 89.1% |
| Immigrants | Italy | 14.0 /100 | #209 | Poor 89.1% |
| Dutch West Indians | 13.5 /100 | #210 | Poor 89.0% |
| Sierra Leoneans | 13.0 /100 | #211 | Poor 89.0% |
| Somalis | 12.8 /100 | #212 | Poor 89.0% |
| Immigrants | Western Asia | 12.3 /100 | #213 | Poor 89.0% |