Immigrants from Egypt vs Immigrants from Malaysia Unemployment Among Women with Children Ages 6 to 17 years
COMPARE
Immigrants from Egypt
Immigrants from Malaysia
Unemployment Among Women with Children Ages 6 to 17 years
Unemployment Among Women with Children Ages 6 to 17 years Comparison
Immigrants from Egypt
Immigrants from Malaysia
8.7%
UNEMPLOYMENT AMONG WOMEN WITH CHILDREN AGES 6 TO 17 YEARS
95.0/ 100
METRIC RATING
122nd/ 347
METRIC RANK
8.2%
UNEMPLOYMENT AMONG WOMEN WITH CHILDREN AGES 6 TO 17 YEARS
100.0/ 100
METRIC RATING
58th/ 347
METRIC RANK
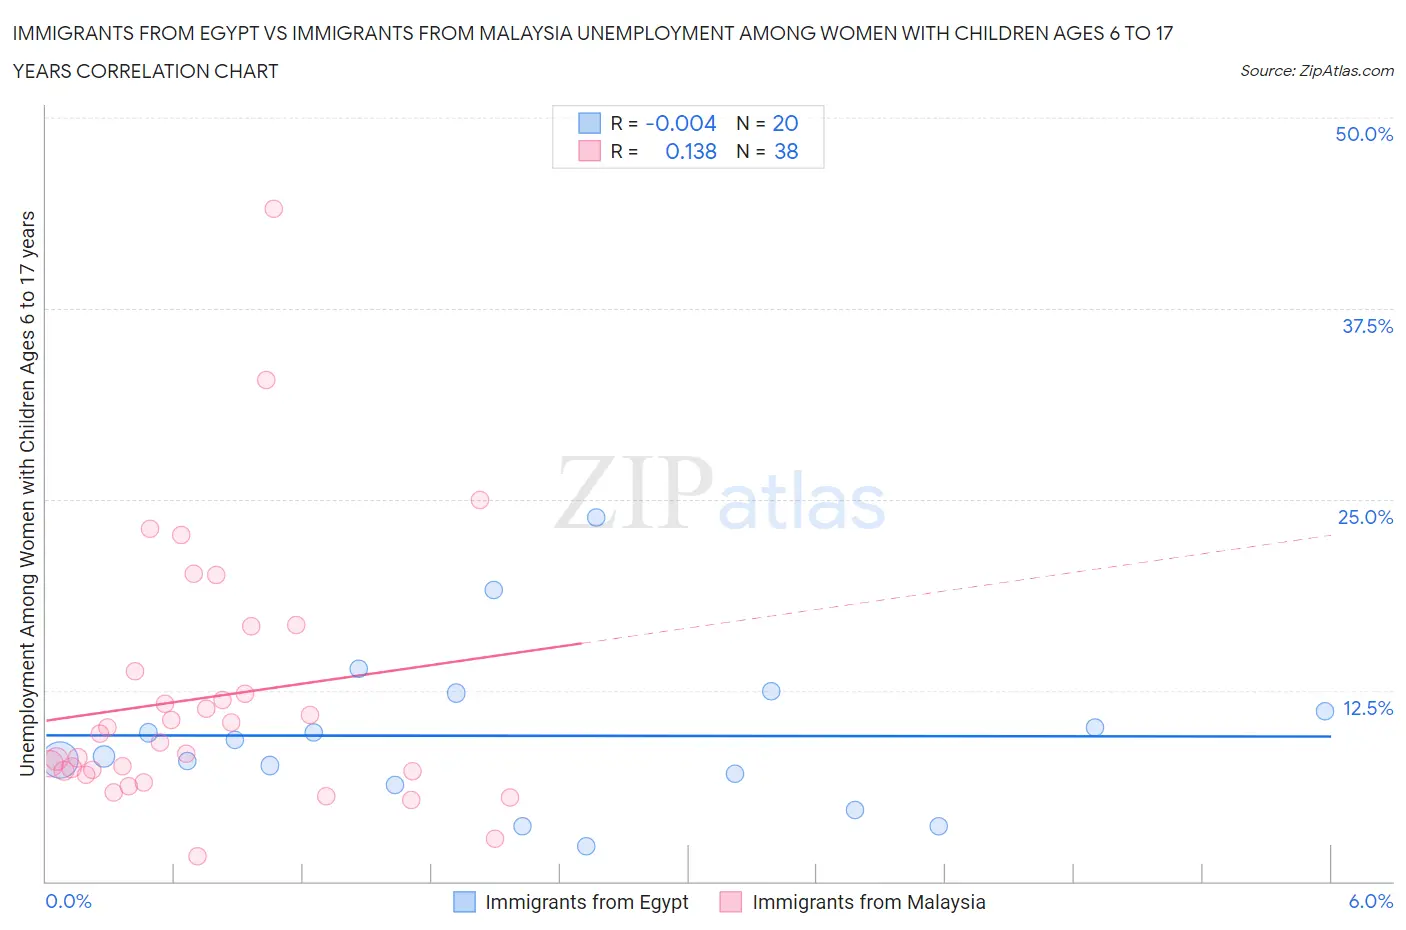
Immigrants from Egypt vs Immigrants from Malaysia Unemployment Among Women with Children Ages 6 to 17 years Correlation Chart
The statistical analysis conducted on geographies consisting of 192,263,747 people shows no correlation between the proportion of Immigrants from Egypt and unemployment rate among women with children between the ages 6 and 17 in the United States with a correlation coefficient (R) of -0.004 and weighted average of 8.7%. Similarly, the statistical analysis conducted on geographies consisting of 160,783,696 people shows a poor positive correlation between the proportion of Immigrants from Malaysia and unemployment rate among women with children between the ages 6 and 17 in the United States with a correlation coefficient (R) of 0.138 and weighted average of 8.2%, a difference of 6.0%.
Unemployment Among Women with Children Ages 6 to 17 years Correlation Summary
| Measurement | Immigrants from Egypt | Immigrants from Malaysia |
| Minimum | 2.3% | 1.6% |
| Maximum | 23.8% | 44.0% |
| Range | 21.5% | 42.4% |
| Mean | 9.5% | 12.0% |
| Median | 8.7% | 9.4% |
| Interquartile 25% (IQ1) | 6.6% | 7.2% |
| Interquartile 75% (IQ3) | 11.7% | 13.8% |
| Interquartile Range (IQR) | 5.1% | 6.6% |
| Standard Deviation (Sample) | 5.2% | 8.5% |
| Standard Deviation (Population) | 5.0% | 8.4% |
Similar Demographics by Unemployment Among Women with Children Ages 6 to 17 years
Demographics Similar to Immigrants from Egypt by Unemployment Among Women with Children Ages 6 to 17 years
In terms of unemployment among women with children ages 6 to 17 years, the demographic groups most similar to Immigrants from Egypt are Immigrants from Morocco (8.7%, a difference of 0.040%), Immigrants from Lebanon (8.7%, a difference of 0.040%), South African (8.7%, a difference of 0.11%), Immigrants from Denmark (8.7%, a difference of 0.12%), and Immigrants from Northern Africa (8.7%, a difference of 0.13%).
| Demographics | Rating | Rank | Unemployment Among Women with Children Ages 6 to 17 years |
| Argentineans | 96.5 /100 | #115 | Exceptional 8.6% |
| Zimbabweans | 96.3 /100 | #116 | Exceptional 8.6% |
| Albanians | 96.3 /100 | #117 | Exceptional 8.6% |
| Pueblo | 96.2 /100 | #118 | Exceptional 8.6% |
| Immigrants | Grenada | 96.2 /100 | #119 | Exceptional 8.6% |
| Israelis | 95.9 /100 | #120 | Exceptional 8.7% |
| Immigrants | Denmark | 95.5 /100 | #121 | Exceptional 8.7% |
| Immigrants | Egypt | 95.0 /100 | #122 | Exceptional 8.7% |
| Immigrants | Morocco | 94.9 /100 | #123 | Exceptional 8.7% |
| Immigrants | Lebanon | 94.9 /100 | #124 | Exceptional 8.7% |
| South Africans | 94.6 /100 | #125 | Exceptional 8.7% |
| Immigrants | Northern Africa | 94.4 /100 | #126 | Exceptional 8.7% |
| Czechs | 94.4 /100 | #127 | Exceptional 8.7% |
| Hmong | 94.3 /100 | #128 | Exceptional 8.7% |
| Barbadians | 93.8 /100 | #129 | Exceptional 8.7% |
Demographics Similar to Immigrants from Malaysia by Unemployment Among Women with Children Ages 6 to 17 years
In terms of unemployment among women with children ages 6 to 17 years, the demographic groups most similar to Immigrants from Malaysia are Immigrants from Philippines (8.2%, a difference of 0.060%), Basque (8.2%, a difference of 0.070%), Immigrants from Laos (8.2%, a difference of 0.19%), Immigrants from Bosnia and Herzegovina (8.2%, a difference of 0.21%), and Immigrants from Japan (8.2%, a difference of 0.23%).
| Demographics | Rating | Rank | Unemployment Among Women with Children Ages 6 to 17 years |
| Immigrants | Sudan | 100.0 /100 | #51 | Exceptional 8.1% |
| Immigrants | Iraq | 100.0 /100 | #52 | Exceptional 8.1% |
| Danes | 100.0 /100 | #53 | Exceptional 8.1% |
| Immigrants | Armenia | 100.0 /100 | #54 | Exceptional 8.2% |
| Immigrants | Japan | 100.0 /100 | #55 | Exceptional 8.2% |
| Immigrants | Bosnia and Herzegovina | 100.0 /100 | #56 | Exceptional 8.2% |
| Immigrants | Laos | 100.0 /100 | #57 | Exceptional 8.2% |
| Immigrants | Malaysia | 100.0 /100 | #58 | Exceptional 8.2% |
| Immigrants | Philippines | 100.0 /100 | #59 | Exceptional 8.2% |
| Basques | 100.0 /100 | #60 | Exceptional 8.2% |
| Koreans | 100.0 /100 | #61 | Exceptional 8.2% |
| Spanish American Indians | 100.0 /100 | #62 | Exceptional 8.2% |
| Immigrants | South Eastern Asia | 99.9 /100 | #63 | Exceptional 8.2% |
| Immigrants | Kuwait | 99.9 /100 | #64 | Exceptional 8.3% |
| Immigrants | Albania | 99.9 /100 | #65 | Exceptional 8.3% |