Immigrants from Egypt vs Cherokee Unemployment Among Women with Children Ages 6 to 17 years
COMPARE
Immigrants from Egypt
Cherokee
Unemployment Among Women with Children Ages 6 to 17 years
Unemployment Among Women with Children Ages 6 to 17 years Comparison
Immigrants from Egypt
Cherokee
8.7%
UNEMPLOYMENT AMONG WOMEN WITH CHILDREN AGES 6 TO 17 YEARS
95.0/ 100
METRIC RATING
122nd/ 347
METRIC RANK
10.0%
UNEMPLOYMENT AMONG WOMEN WITH CHILDREN AGES 6 TO 17 YEARS
0.0/ 100
METRIC RATING
295th/ 347
METRIC RANK
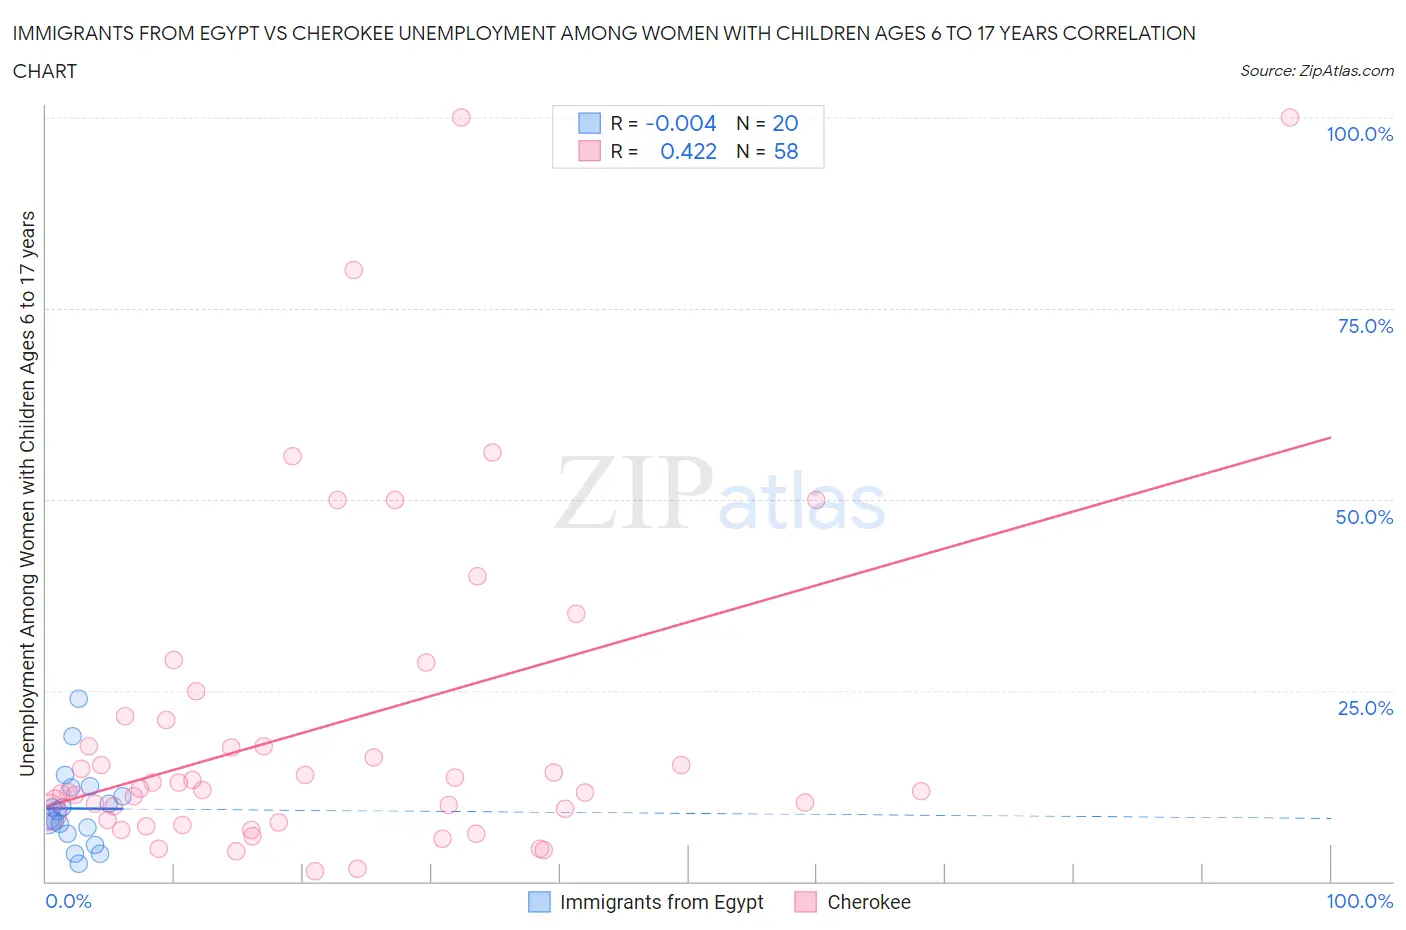
Immigrants from Egypt vs Cherokee Unemployment Among Women with Children Ages 6 to 17 years Correlation Chart
The statistical analysis conducted on geographies consisting of 192,263,747 people shows no correlation between the proportion of Immigrants from Egypt and unemployment rate among women with children between the ages 6 and 17 in the United States with a correlation coefficient (R) of -0.004 and weighted average of 8.7%. Similarly, the statistical analysis conducted on geographies consisting of 331,434,739 people shows a moderate positive correlation between the proportion of Cherokee and unemployment rate among women with children between the ages 6 and 17 in the United States with a correlation coefficient (R) of 0.422 and weighted average of 10.0%, a difference of 15.7%.
Unemployment Among Women with Children Ages 6 to 17 years Correlation Summary
| Measurement | Immigrants from Egypt | Cherokee |
| Minimum | 2.3% | 1.3% |
| Maximum | 23.8% | 100.0% |
| Range | 21.5% | 98.7% |
| Mean | 9.5% | 20.4% |
| Median | 8.7% | 12.0% |
| Interquartile 25% (IQ1) | 6.6% | 8.0% |
| Interquartile 75% (IQ3) | 11.7% | 21.1% |
| Interquartile Range (IQR) | 5.1% | 13.2% |
| Standard Deviation (Sample) | 5.2% | 21.9% |
| Standard Deviation (Population) | 5.0% | 21.7% |
Similar Demographics by Unemployment Among Women with Children Ages 6 to 17 years
Demographics Similar to Immigrants from Egypt by Unemployment Among Women with Children Ages 6 to 17 years
In terms of unemployment among women with children ages 6 to 17 years, the demographic groups most similar to Immigrants from Egypt are Immigrants from Morocco (8.7%, a difference of 0.040%), Immigrants from Lebanon (8.7%, a difference of 0.040%), South African (8.7%, a difference of 0.11%), Immigrants from Denmark (8.7%, a difference of 0.12%), and Immigrants from Northern Africa (8.7%, a difference of 0.13%).
| Demographics | Rating | Rank | Unemployment Among Women with Children Ages 6 to 17 years |
| Argentineans | 96.5 /100 | #115 | Exceptional 8.6% |
| Zimbabweans | 96.3 /100 | #116 | Exceptional 8.6% |
| Albanians | 96.3 /100 | #117 | Exceptional 8.6% |
| Pueblo | 96.2 /100 | #118 | Exceptional 8.6% |
| Immigrants | Grenada | 96.2 /100 | #119 | Exceptional 8.6% |
| Israelis | 95.9 /100 | #120 | Exceptional 8.7% |
| Immigrants | Denmark | 95.5 /100 | #121 | Exceptional 8.7% |
| Immigrants | Egypt | 95.0 /100 | #122 | Exceptional 8.7% |
| Immigrants | Morocco | 94.9 /100 | #123 | Exceptional 8.7% |
| Immigrants | Lebanon | 94.9 /100 | #124 | Exceptional 8.7% |
| South Africans | 94.6 /100 | #125 | Exceptional 8.7% |
| Immigrants | Northern Africa | 94.4 /100 | #126 | Exceptional 8.7% |
| Czechs | 94.4 /100 | #127 | Exceptional 8.7% |
| Hmong | 94.3 /100 | #128 | Exceptional 8.7% |
| Barbadians | 93.8 /100 | #129 | Exceptional 8.7% |
Demographics Similar to Cherokee by Unemployment Among Women with Children Ages 6 to 17 years
In terms of unemployment among women with children ages 6 to 17 years, the demographic groups most similar to Cherokee are Ecuadorian (10.0%, a difference of 0.030%), Haitian (10.0%, a difference of 0.13%), Carpatho Rusyn (10.0%, a difference of 0.22%), Nonimmigrants (10.0%, a difference of 0.23%), and Subsaharan African (10.0%, a difference of 0.25%).
| Demographics | Rating | Rank | Unemployment Among Women with Children Ages 6 to 17 years |
| Shoshone | 0.0 /100 | #288 | Tragic 10.0% |
| Hondurans | 0.0 /100 | #289 | Tragic 10.0% |
| Sub-Saharan Africans | 0.0 /100 | #290 | Tragic 10.0% |
| Immigrants | Nonimmigrants | 0.0 /100 | #291 | Tragic 10.0% |
| Carpatho Rusyns | 0.0 /100 | #292 | Tragic 10.0% |
| Haitians | 0.0 /100 | #293 | Tragic 10.0% |
| Ecuadorians | 0.0 /100 | #294 | Tragic 10.0% |
| Cherokee | 0.0 /100 | #295 | Tragic 10.0% |
| Immigrants | Western Africa | 0.0 /100 | #296 | Tragic 10.1% |
| Immigrants | Caribbean | 0.0 /100 | #297 | Tragic 10.1% |
| Immigrants | Haiti | 0.0 /100 | #298 | Tragic 10.1% |
| Immigrants | Honduras | 0.0 /100 | #299 | Tragic 10.1% |
| Nigerians | 0.0 /100 | #300 | Tragic 10.1% |
| Immigrants | Bahamas | 0.0 /100 | #301 | Tragic 10.1% |
| Venezuelans | 0.0 /100 | #302 | Tragic 10.2% |