Immigrants from Egypt vs Immigrants from Malaysia Householder Income Ages 45 - 64 years
COMPARE
Immigrants from Egypt
Immigrants from Malaysia
Householder Income Ages 45 - 64 years
Householder Income Ages 45 - 64 years Comparison
Immigrants from Egypt
Immigrants from Malaysia
$109,941
HOUSEHOLDER INCOME AGES 45 - 64 YEARS
99.2/ 100
METRIC RATING
74th/ 347
METRIC RANK
$112,796
HOUSEHOLDER INCOME AGES 45 - 64 YEARS
99.8/ 100
METRIC RATING
52nd/ 347
METRIC RANK
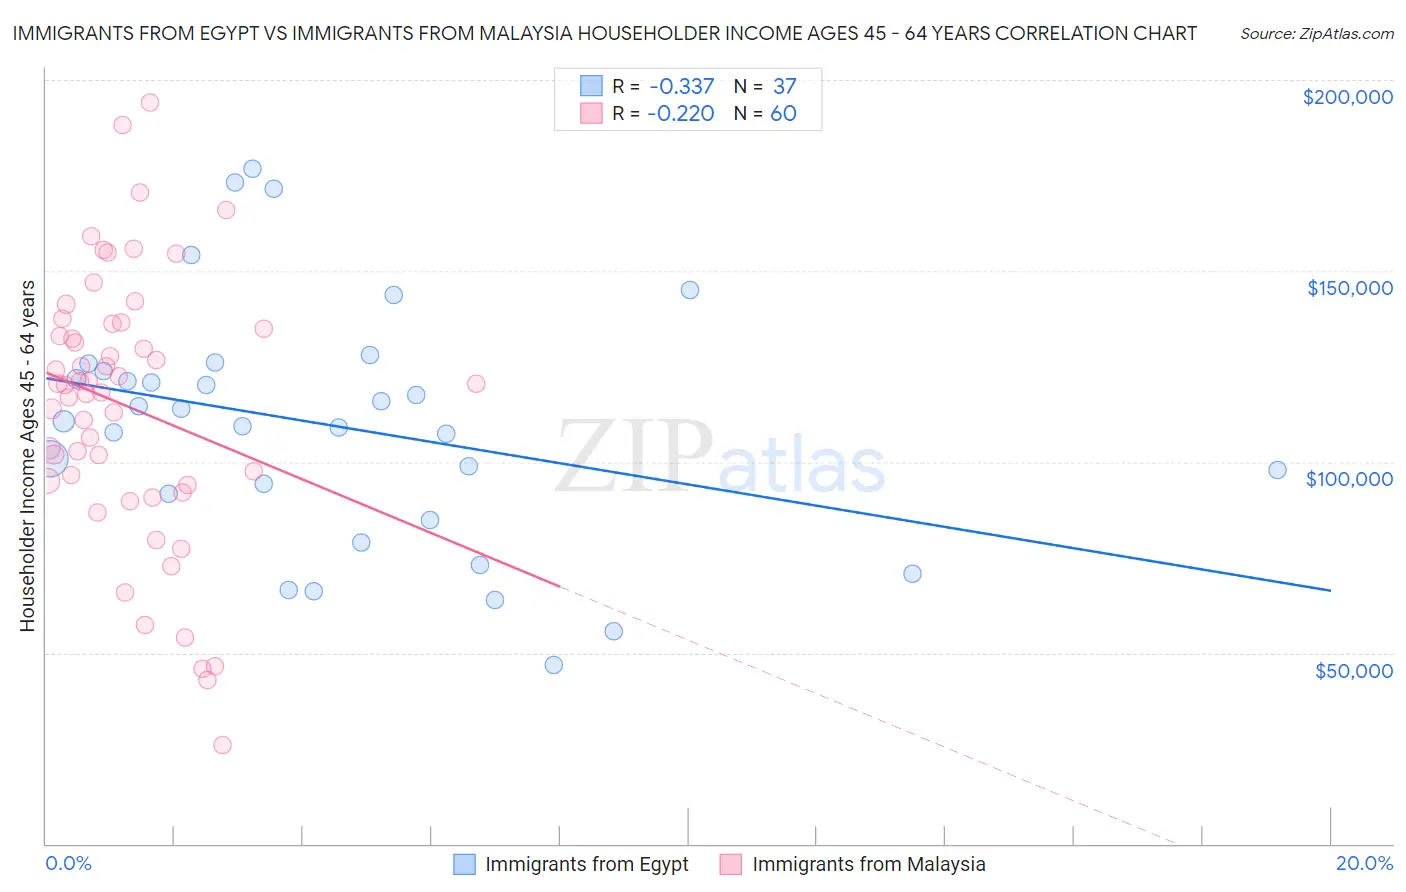
Immigrants from Egypt vs Immigrants from Malaysia Householder Income Ages 45 - 64 years Correlation Chart
The statistical analysis conducted on geographies consisting of 245,345,786 people shows a mild negative correlation between the proportion of Immigrants from Egypt and household income with householder between the ages 45 and 64 in the United States with a correlation coefficient (R) of -0.337 and weighted average of $109,941. Similarly, the statistical analysis conducted on geographies consisting of 197,847,367 people shows a weak negative correlation between the proportion of Immigrants from Malaysia and household income with householder between the ages 45 and 64 in the United States with a correlation coefficient (R) of -0.220 and weighted average of $112,796, a difference of 2.6%.
Householder Income Ages 45 - 64 years Correlation Summary
| Measurement | Immigrants from Egypt | Immigrants from Malaysia |
| Minimum | $46,773 | $25,952 |
| Maximum | $176,674 | $194,219 |
| Range | $129,901 | $168,267 |
| Mean | $109,415 | $114,501 |
| Median | $110,780 | $120,322 |
| Interquartile 25% (IQ1) | $88,195 | $94,457 |
| Interquartile 75% (IQ3) | $124,792 | $135,508 |
| Interquartile Range (IQR) | $36,597 | $41,051 |
| Standard Deviation (Sample) | $31,863 | $35,239 |
| Standard Deviation (Population) | $31,429 | $34,945 |
Similar Demographics by Householder Income Ages 45 - 64 years
Demographics Similar to Immigrants from Egypt by Householder Income Ages 45 - 64 years
In terms of householder income ages 45 - 64 years, the demographic groups most similar to Immigrants from Egypt are Argentinean ($110,103, a difference of 0.15%), South African ($109,719, a difference of 0.20%), Assyrian/Chaldean/Syriac ($110,201, a difference of 0.24%), Italian ($110,224, a difference of 0.26%), and Korean ($110,334, a difference of 0.36%).
| Demographics | Rating | Rank | Householder Income Ages 45 - 64 years |
| Laotians | 99.5 /100 | #67 | Exceptional $111,051 |
| Immigrants | Romania | 99.4 /100 | #68 | Exceptional $110,633 |
| Immigrants | Italy | 99.4 /100 | #69 | Exceptional $110,434 |
| Koreans | 99.3 /100 | #70 | Exceptional $110,334 |
| Italians | 99.3 /100 | #71 | Exceptional $110,224 |
| Assyrians/Chaldeans/Syriacs | 99.3 /100 | #72 | Exceptional $110,201 |
| Argentineans | 99.3 /100 | #73 | Exceptional $110,103 |
| Immigrants | Egypt | 99.2 /100 | #74 | Exceptional $109,941 |
| South Africans | 99.1 /100 | #75 | Exceptional $109,719 |
| Paraguayans | 99.0 /100 | #76 | Exceptional $109,447 |
| Immigrants | England | 99.0 /100 | #77 | Exceptional $109,446 |
| Immigrants | Canada | 99.0 /100 | #78 | Exceptional $109,402 |
| Immigrants | Bulgaria | 98.9 /100 | #79 | Exceptional $109,379 |
| Jordanians | 98.9 /100 | #80 | Exceptional $109,376 |
| Immigrants | Eastern Europe | 98.9 /100 | #81 | Exceptional $109,335 |
Demographics Similar to Immigrants from Malaysia by Householder Income Ages 45 - 64 years
In terms of householder income ages 45 - 64 years, the demographic groups most similar to Immigrants from Malaysia are Immigrants from South Africa ($112,886, a difference of 0.080%), Afghan ($112,676, a difference of 0.11%), Greek ($112,630, a difference of 0.15%), Lithuanian ($112,484, a difference of 0.28%), and Immigrants from Austria ($113,140, a difference of 0.30%).
| Demographics | Rating | Rank | Householder Income Ages 45 - 64 years |
| Immigrants | France | 99.9 /100 | #45 | Exceptional $113,680 |
| Immigrants | Greece | 99.9 /100 | #46 | Exceptional $113,548 |
| Australians | 99.9 /100 | #47 | Exceptional $113,533 |
| Immigrants | Indonesia | 99.9 /100 | #48 | Exceptional $113,519 |
| Immigrants | Russia | 99.8 /100 | #49 | Exceptional $113,215 |
| Immigrants | Austria | 99.8 /100 | #50 | Exceptional $113,140 |
| Immigrants | South Africa | 99.8 /100 | #51 | Exceptional $112,886 |
| Immigrants | Malaysia | 99.8 /100 | #52 | Exceptional $112,796 |
| Afghans | 99.8 /100 | #53 | Exceptional $112,676 |
| Greeks | 99.8 /100 | #54 | Exceptional $112,630 |
| Lithuanians | 99.8 /100 | #55 | Exceptional $112,484 |
| Egyptians | 99.7 /100 | #56 | Exceptional $112,256 |
| Immigrants | Scotland | 99.7 /100 | #57 | Exceptional $112,175 |
| Soviet Union | 99.7 /100 | #58 | Exceptional $112,008 |
| Immigrants | Europe | 99.7 /100 | #59 | Exceptional $111,984 |