Immigrants from Egypt vs Central American Indian Unemployment Among Women with Children Ages 6 to 17 years
COMPARE
Immigrants from Egypt
Central American Indian
Unemployment Among Women with Children Ages 6 to 17 years
Unemployment Among Women with Children Ages 6 to 17 years Comparison
Immigrants from Egypt
Central American Indians
8.7%
UNEMPLOYMENT AMONG WOMEN WITH CHILDREN AGES 6 TO 17 YEARS
95.0/ 100
METRIC RATING
122nd/ 347
METRIC RANK
9.9%
UNEMPLOYMENT AMONG WOMEN WITH CHILDREN AGES 6 TO 17 YEARS
0.0/ 100
METRIC RATING
283rd/ 347
METRIC RANK
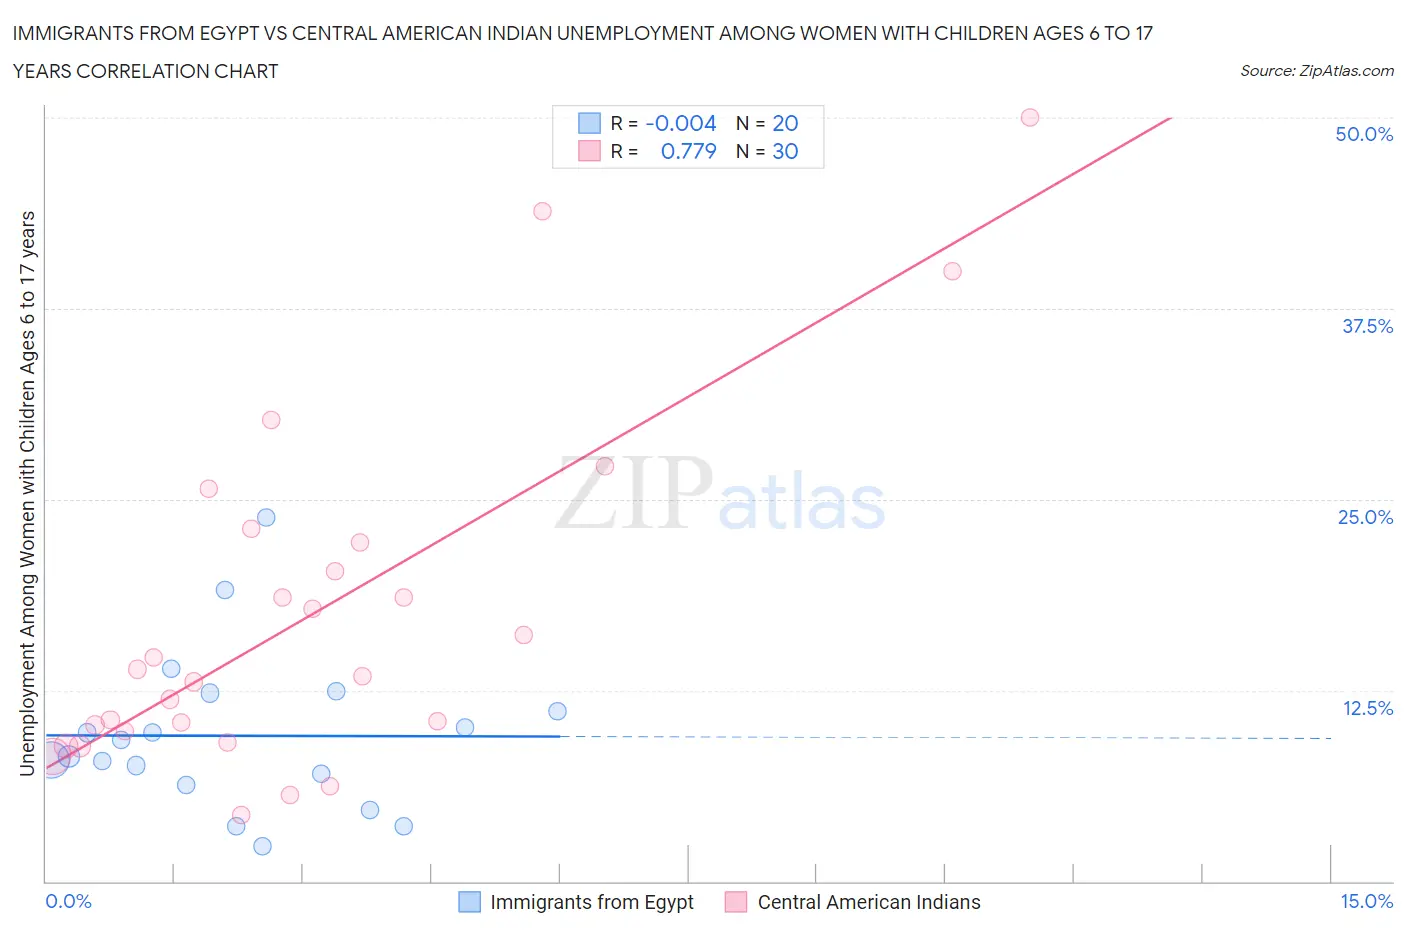
Immigrants from Egypt vs Central American Indian Unemployment Among Women with Children Ages 6 to 17 years Correlation Chart
The statistical analysis conducted on geographies consisting of 192,263,747 people shows no correlation between the proportion of Immigrants from Egypt and unemployment rate among women with children between the ages 6 and 17 in the United States with a correlation coefficient (R) of -0.004 and weighted average of 8.7%. Similarly, the statistical analysis conducted on geographies consisting of 253,474,546 people shows a strong positive correlation between the proportion of Central American Indians and unemployment rate among women with children between the ages 6 and 17 in the United States with a correlation coefficient (R) of 0.779 and weighted average of 9.9%, a difference of 13.9%.
Unemployment Among Women with Children Ages 6 to 17 years Correlation Summary
| Measurement | Immigrants from Egypt | Central American Indian |
| Minimum | 2.3% | 4.3% |
| Maximum | 23.8% | 50.0% |
| Range | 21.5% | 45.7% |
| Mean | 9.5% | 17.4% |
| Median | 8.7% | 13.6% |
| Interquartile 25% (IQ1) | 6.6% | 9.9% |
| Interquartile 75% (IQ3) | 11.7% | 22.2% |
| Interquartile Range (IQR) | 5.1% | 12.3% |
| Standard Deviation (Sample) | 5.2% | 11.4% |
| Standard Deviation (Population) | 5.0% | 11.2% |
Similar Demographics by Unemployment Among Women with Children Ages 6 to 17 years
Demographics Similar to Immigrants from Egypt by Unemployment Among Women with Children Ages 6 to 17 years
In terms of unemployment among women with children ages 6 to 17 years, the demographic groups most similar to Immigrants from Egypt are Immigrants from Morocco (8.7%, a difference of 0.040%), Immigrants from Lebanon (8.7%, a difference of 0.040%), South African (8.7%, a difference of 0.11%), Immigrants from Denmark (8.7%, a difference of 0.12%), and Immigrants from Northern Africa (8.7%, a difference of 0.13%).
| Demographics | Rating | Rank | Unemployment Among Women with Children Ages 6 to 17 years |
| Argentineans | 96.5 /100 | #115 | Exceptional 8.6% |
| Zimbabweans | 96.3 /100 | #116 | Exceptional 8.6% |
| Albanians | 96.3 /100 | #117 | Exceptional 8.6% |
| Pueblo | 96.2 /100 | #118 | Exceptional 8.6% |
| Immigrants | Grenada | 96.2 /100 | #119 | Exceptional 8.6% |
| Israelis | 95.9 /100 | #120 | Exceptional 8.7% |
| Immigrants | Denmark | 95.5 /100 | #121 | Exceptional 8.7% |
| Immigrants | Egypt | 95.0 /100 | #122 | Exceptional 8.7% |
| Immigrants | Morocco | 94.9 /100 | #123 | Exceptional 8.7% |
| Immigrants | Lebanon | 94.9 /100 | #124 | Exceptional 8.7% |
| South Africans | 94.6 /100 | #125 | Exceptional 8.7% |
| Immigrants | Northern Africa | 94.4 /100 | #126 | Exceptional 8.7% |
| Czechs | 94.4 /100 | #127 | Exceptional 8.7% |
| Hmong | 94.3 /100 | #128 | Exceptional 8.7% |
| Barbadians | 93.8 /100 | #129 | Exceptional 8.7% |
Demographics Similar to Central American Indians by Unemployment Among Women with Children Ages 6 to 17 years
In terms of unemployment among women with children ages 6 to 17 years, the demographic groups most similar to Central American Indians are Yakama (9.9%, a difference of 0.15%), Hispanic or Latino (9.9%, a difference of 0.46%), Choctaw (9.9%, a difference of 0.58%), Sierra Leonean (9.9%, a difference of 0.63%), and Slovak (9.8%, a difference of 0.83%).
| Demographics | Rating | Rank | Unemployment Among Women with Children Ages 6 to 17 years |
| Immigrants | Portugal | 0.1 /100 | #276 | Tragic 9.7% |
| British West Indians | 0.1 /100 | #277 | Tragic 9.7% |
| French | 0.1 /100 | #278 | Tragic 9.7% |
| Scotch-Irish | 0.1 /100 | #279 | Tragic 9.7% |
| Seminole | 0.1 /100 | #280 | Tragic 9.7% |
| Jamaicans | 0.0 /100 | #281 | Tragic 9.8% |
| Slovaks | 0.0 /100 | #282 | Tragic 9.8% |
| Central American Indians | 0.0 /100 | #283 | Tragic 9.9% |
| Yakama | 0.0 /100 | #284 | Tragic 9.9% |
| Hispanics or Latinos | 0.0 /100 | #285 | Tragic 9.9% |
| Choctaw | 0.0 /100 | #286 | Tragic 9.9% |
| Sierra Leoneans | 0.0 /100 | #287 | Tragic 9.9% |
| Shoshone | 0.0 /100 | #288 | Tragic 10.0% |
| Hondurans | 0.0 /100 | #289 | Tragic 10.0% |
| Sub-Saharan Africans | 0.0 /100 | #290 | Tragic 10.0% |