Immigrants from Egypt vs Scandinavian Unemployment Among Women with Children Ages 6 to 17 years
COMPARE
Immigrants from Egypt
Scandinavian
Unemployment Among Women with Children Ages 6 to 17 years
Unemployment Among Women with Children Ages 6 to 17 years Comparison
Immigrants from Egypt
Scandinavians
8.7%
UNEMPLOYMENT AMONG WOMEN WITH CHILDREN AGES 6 TO 17 YEARS
95.0/ 100
METRIC RATING
122nd/ 347
METRIC RANK
8.6%
UNEMPLOYMENT AMONG WOMEN WITH CHILDREN AGES 6 TO 17 YEARS
98.3/ 100
METRIC RATING
103rd/ 347
METRIC RANK
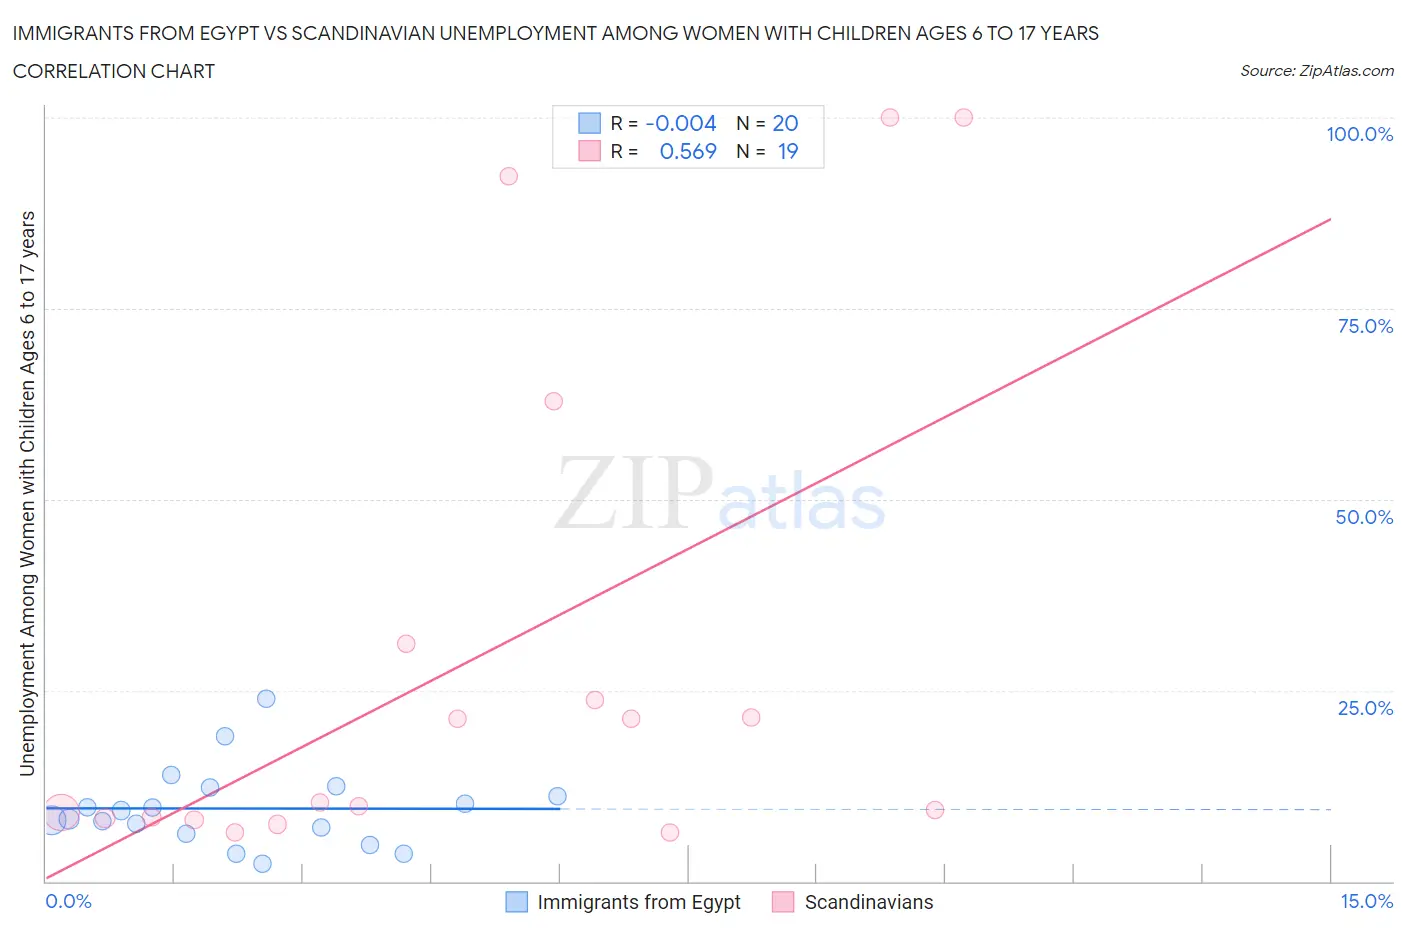
Immigrants from Egypt vs Scandinavian Unemployment Among Women with Children Ages 6 to 17 years Correlation Chart
The statistical analysis conducted on geographies consisting of 192,263,747 people shows no correlation between the proportion of Immigrants from Egypt and unemployment rate among women with children between the ages 6 and 17 in the United States with a correlation coefficient (R) of -0.004 and weighted average of 8.7%. Similarly, the statistical analysis conducted on geographies consisting of 313,345,365 people shows a substantial positive correlation between the proportion of Scandinavians and unemployment rate among women with children between the ages 6 and 17 in the United States with a correlation coefficient (R) of 0.569 and weighted average of 8.6%, a difference of 1.3%.
Unemployment Among Women with Children Ages 6 to 17 years Correlation Summary
| Measurement | Immigrants from Egypt | Scandinavian |
| Minimum | 2.3% | 6.3% |
| Maximum | 23.8% | 100.0% |
| Range | 21.5% | 93.7% |
| Mean | 9.5% | 29.3% |
| Median | 8.7% | 10.3% |
| Interquartile 25% (IQ1) | 6.6% | 8.3% |
| Interquartile 75% (IQ3) | 11.7% | 31.1% |
| Interquartile Range (IQR) | 5.1% | 22.8% |
| Standard Deviation (Sample) | 5.2% | 33.1% |
| Standard Deviation (Population) | 5.0% | 32.2% |
Demographics Similar to Immigrants from Egypt and Scandinavians by Unemployment Among Women with Children Ages 6 to 17 years
In terms of unemployment among women with children ages 6 to 17 years, the demographic groups most similar to Immigrants from Egypt are Immigrants from Denmark (8.7%, a difference of 0.12%), Israeli (8.7%, a difference of 0.23%), Immigrants from Grenada (8.6%, a difference of 0.31%), Pueblo (8.6%, a difference of 0.32%), and Albanian (8.6%, a difference of 0.36%). Similarly, the demographic groups most similar to Scandinavians are Immigrants from South Africa (8.6%, a difference of 0.010%), Immigrants from France (8.6%, a difference of 0.18%), Immigrants from Norway (8.6%, a difference of 0.33%), Immigrants from Serbia (8.6%, a difference of 0.37%), and Chickasaw (8.6%, a difference of 0.40%).
| Demographics | Rating | Rank | Unemployment Among Women with Children Ages 6 to 17 years |
| Immigrants | South Africa | 98.3 /100 | #102 | Exceptional 8.6% |
| Scandinavians | 98.3 /100 | #103 | Exceptional 8.6% |
| Immigrants | France | 98.0 /100 | #104 | Exceptional 8.6% |
| Immigrants | Norway | 97.8 /100 | #105 | Exceptional 8.6% |
| Immigrants | Serbia | 97.7 /100 | #106 | Exceptional 8.6% |
| Chickasaw | 97.6 /100 | #107 | Exceptional 8.6% |
| Swedes | 97.6 /100 | #108 | Exceptional 8.6% |
| Immigrants | Romania | 97.5 /100 | #109 | Exceptional 8.6% |
| Latvians | 97.4 /100 | #110 | Exceptional 8.6% |
| Immigrants | Ukraine | 97.4 /100 | #111 | Exceptional 8.6% |
| Romanians | 97.1 /100 | #112 | Exceptional 8.6% |
| Eastern Europeans | 96.8 /100 | #113 | Exceptional 8.6% |
| Immigrants | Russia | 96.7 /100 | #114 | Exceptional 8.6% |
| Argentineans | 96.5 /100 | #115 | Exceptional 8.6% |
| Zimbabweans | 96.3 /100 | #116 | Exceptional 8.6% |
| Albanians | 96.3 /100 | #117 | Exceptional 8.6% |
| Pueblo | 96.2 /100 | #118 | Exceptional 8.6% |
| Immigrants | Grenada | 96.2 /100 | #119 | Exceptional 8.6% |
| Israelis | 95.9 /100 | #120 | Exceptional 8.7% |
| Immigrants | Denmark | 95.5 /100 | #121 | Exceptional 8.7% |
| Immigrants | Egypt | 95.0 /100 | #122 | Exceptional 8.7% |