Immigrants from China vs Bermudan Male Unemployment
COMPARE
Immigrants from China
Bermudan
Male Unemployment
Male Unemployment Comparison
Immigrants from China
Bermudans
5.2%
MALE UNEMPLOYMENT
70.6/ 100
METRIC RATING
161st/ 347
METRIC RANK
5.9%
MALE UNEMPLOYMENT
0.0/ 100
METRIC RATING
268th/ 347
METRIC RANK
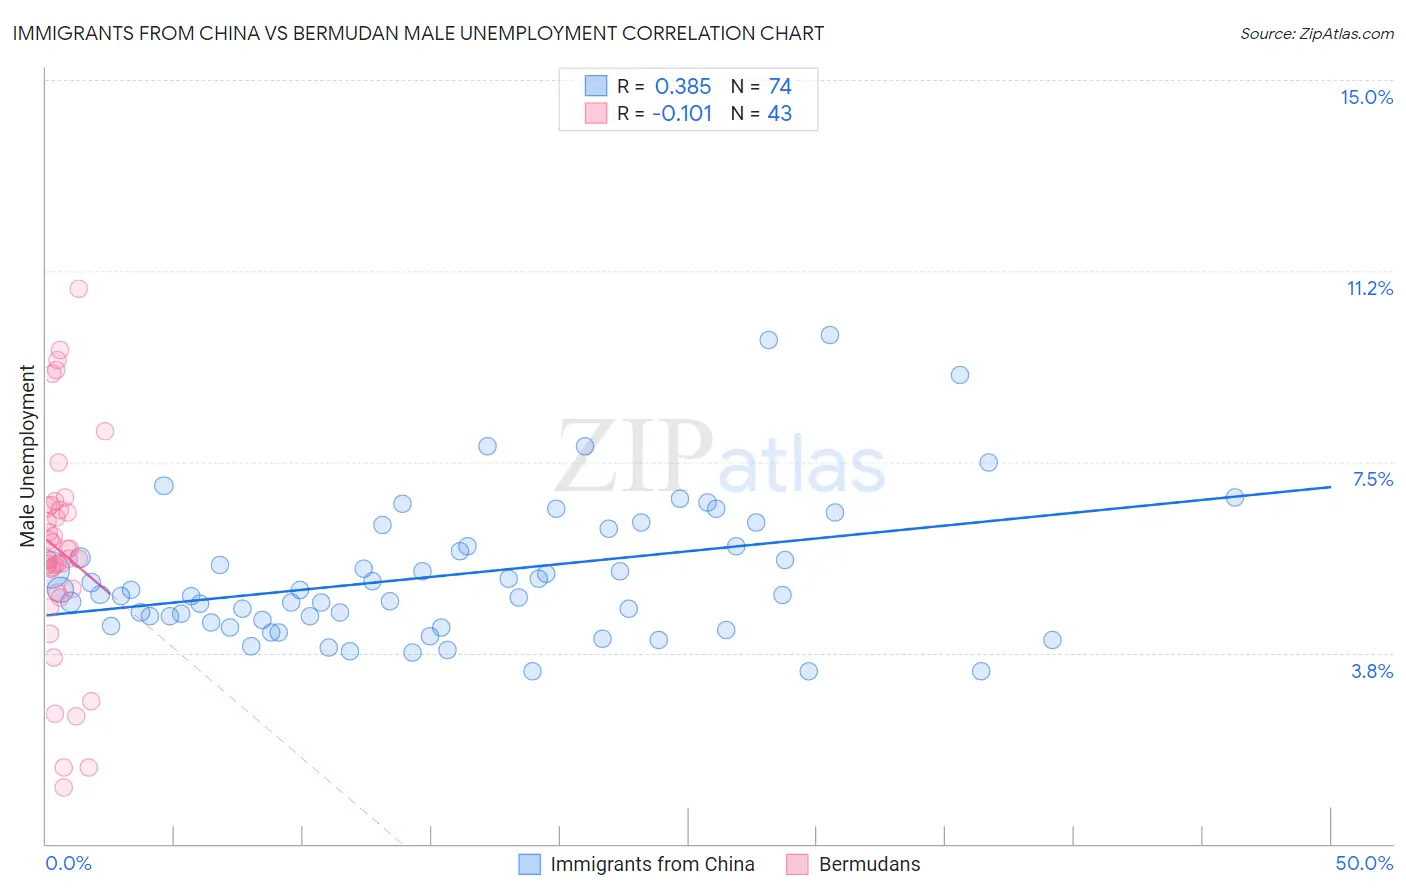
Immigrants from China vs Bermudan Male Unemployment Correlation Chart
The statistical analysis conducted on geographies consisting of 454,688,998 people shows a mild positive correlation between the proportion of Immigrants from China and unemployment rate among males in the United States with a correlation coefficient (R) of 0.385 and weighted average of 5.2%. Similarly, the statistical analysis conducted on geographies consisting of 55,661,801 people shows a poor negative correlation between the proportion of Bermudans and unemployment rate among males in the United States with a correlation coefficient (R) of -0.101 and weighted average of 5.9%, a difference of 13.6%.
Male Unemployment Correlation Summary
| Measurement | Immigrants from China | Bermudan |
| Minimum | 3.4% | 1.1% |
| Maximum | 10.0% | 10.9% |
| Range | 6.6% | 9.8% |
| Mean | 5.3% | 5.7% |
| Median | 4.9% | 5.6% |
| Interquartile 25% (IQ1) | 4.3% | 4.9% |
| Interquartile 75% (IQ3) | 5.9% | 6.6% |
| Interquartile Range (IQR) | 1.5% | 1.7% |
| Standard Deviation (Sample) | 1.4% | 2.1% |
| Standard Deviation (Population) | 1.4% | 2.1% |
Similar Demographics by Male Unemployment
Demographics Similar to Immigrants from China by Male Unemployment
In terms of male unemployment, the demographic groups most similar to Immigrants from China are Immigrants from Norway (5.2%, a difference of 0.030%), Indonesian (5.2%, a difference of 0.040%), Immigrants from Indonesia (5.2%, a difference of 0.070%), Immigrants from Northern Africa (5.2%, a difference of 0.12%), and American (5.2%, a difference of 0.15%).
| Demographics | Rating | Rank | Male Unemployment |
| Laotians | 73.8 /100 | #154 | Good 5.2% |
| Immigrants | Hungary | 73.4 /100 | #155 | Good 5.2% |
| Americans | 72.7 /100 | #156 | Good 5.2% |
| Immigrants | Northern Africa | 72.3 /100 | #157 | Good 5.2% |
| Immigrants | Indonesia | 71.5 /100 | #158 | Good 5.2% |
| Indonesians | 71.2 /100 | #159 | Good 5.2% |
| Immigrants | Norway | 71.0 /100 | #160 | Good 5.2% |
| Immigrants | China | 70.6 /100 | #161 | Good 5.2% |
| Immigrants | Egypt | 65.9 /100 | #162 | Good 5.2% |
| Immigrants | Hong Kong | 65.7 /100 | #163 | Good 5.2% |
| Afghans | 62.0 /100 | #164 | Good 5.3% |
| South Americans | 60.6 /100 | #165 | Good 5.3% |
| Immigrants | Morocco | 60.2 /100 | #166 | Good 5.3% |
| Immigrants | Vietnam | 58.1 /100 | #167 | Average 5.3% |
| Immigrants | Ireland | 57.7 /100 | #168 | Average 5.3% |
Demographics Similar to Bermudans by Male Unemployment
In terms of male unemployment, the demographic groups most similar to Bermudans are Nigerian (5.9%, a difference of 0.21%), Immigrants from Nigeria (6.0%, a difference of 0.27%), Bahamian (5.9%, a difference of 0.33%), Subsaharan African (6.0%, a difference of 0.40%), and French American Indian (5.9%, a difference of 0.47%).
| Demographics | Rating | Rank | Male Unemployment |
| Liberians | 0.1 /100 | #261 | Tragic 5.8% |
| Immigrants | Portugal | 0.1 /100 | #262 | Tragic 5.9% |
| Immigrants | Latin America | 0.1 /100 | #263 | Tragic 5.9% |
| Immigrants | Mexico | 0.0 /100 | #264 | Tragic 5.9% |
| French American Indians | 0.0 /100 | #265 | Tragic 5.9% |
| Bahamians | 0.0 /100 | #266 | Tragic 5.9% |
| Nigerians | 0.0 /100 | #267 | Tragic 5.9% |
| Bermudans | 0.0 /100 | #268 | Tragic 5.9% |
| Immigrants | Nigeria | 0.0 /100 | #269 | Tragic 6.0% |
| Sub-Saharan Africans | 0.0 /100 | #270 | Tragic 6.0% |
| Blackfeet | 0.0 /100 | #271 | Tragic 6.0% |
| Immigrants | Uzbekistan | 0.0 /100 | #272 | Tragic 6.0% |
| Armenians | 0.0 /100 | #273 | Tragic 6.0% |
| Immigrants | Sierra Leone | 0.0 /100 | #274 | Tragic 6.0% |
| Menominee | 0.0 /100 | #275 | Tragic 6.0% |