Immigrants from Belarus vs Slavic Unemployment
COMPARE
Immigrants from Belarus
Slavic
Unemployment
Unemployment Comparison
Immigrants from Belarus
Slavs
5.3%
UNEMPLOYMENT
35.6/ 100
METRIC RATING
189th/ 347
METRIC RANK
4.9%
UNEMPLOYMENT
98.6/ 100
METRIC RATING
68th/ 347
METRIC RANK
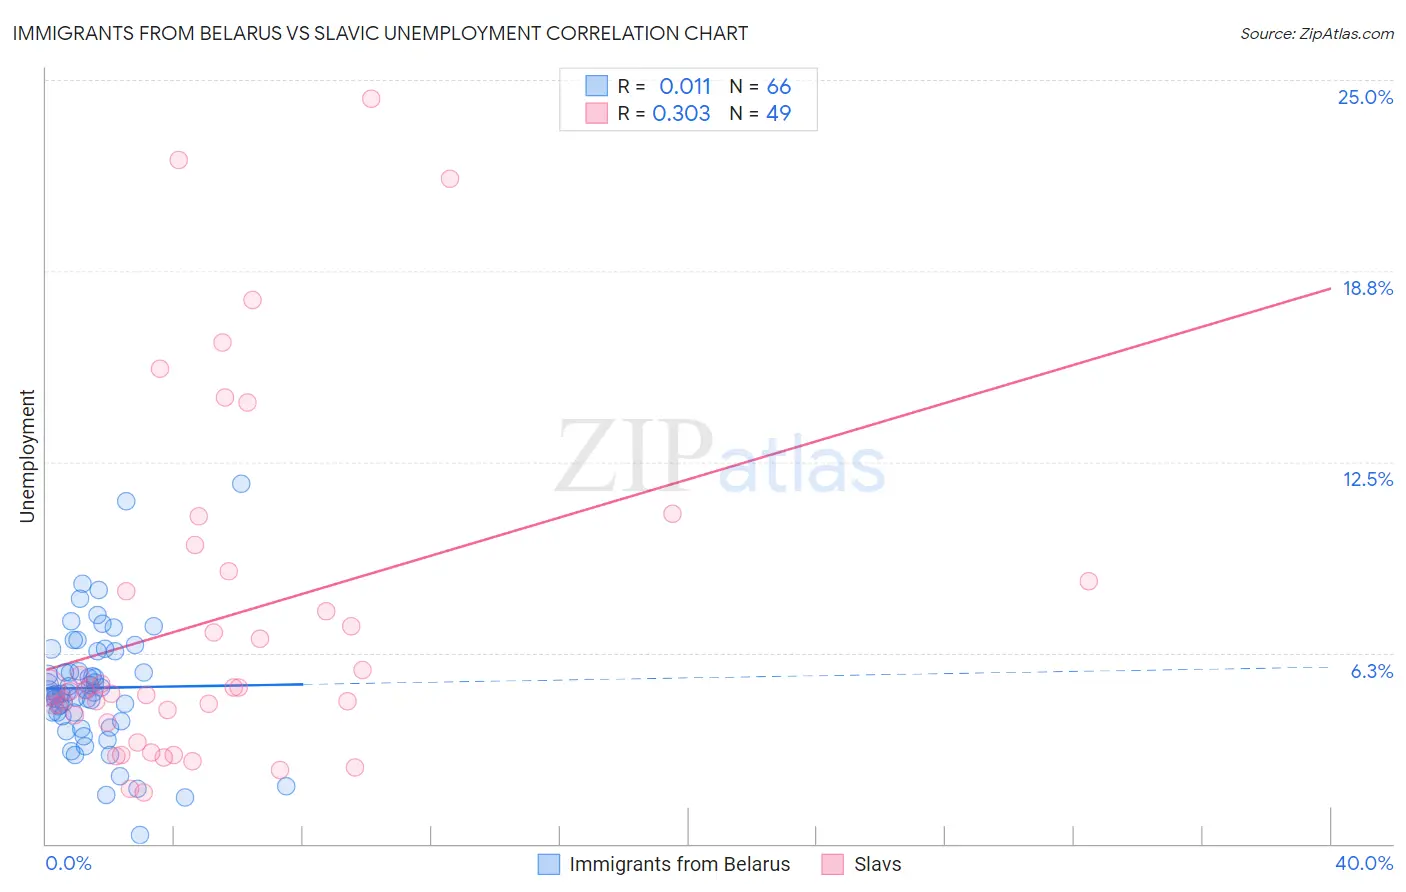
Immigrants from Belarus vs Slavic Unemployment Correlation Chart
The statistical analysis conducted on geographies consisting of 150,154,457 people shows no correlation between the proportion of Immigrants from Belarus and unemployment in the United States with a correlation coefficient (R) of 0.011 and weighted average of 5.3%. Similarly, the statistical analysis conducted on geographies consisting of 270,672,053 people shows a mild positive correlation between the proportion of Slavs and unemployment in the United States with a correlation coefficient (R) of 0.303 and weighted average of 4.9%, a difference of 8.0%.
Unemployment Correlation Summary
| Measurement | Immigrants from Belarus | Slavic |
| Minimum | 0.30% | 1.7% |
| Maximum | 11.8% | 24.4% |
| Range | 11.5% | 22.7% |
| Mean | 5.1% | 7.3% |
| Median | 4.9% | 5.1% |
| Interquartile 25% (IQ1) | 4.2% | 4.1% |
| Interquartile 75% (IQ3) | 6.3% | 8.7% |
| Interquartile Range (IQR) | 2.1% | 4.7% |
| Standard Deviation (Sample) | 2.0% | 5.6% |
| Standard Deviation (Population) | 2.0% | 5.5% |
Similar Demographics by Unemployment
Demographics Similar to Immigrants from Belarus by Unemployment
In terms of unemployment, the demographic groups most similar to Immigrants from Belarus are Arab (5.3%, a difference of 0.020%), Alsatian (5.3%, a difference of 0.090%), Somali (5.3%, a difference of 0.11%), South American (5.3%, a difference of 0.11%), and Costa Rican (5.3%, a difference of 0.12%).
| Demographics | Rating | Rank | Unemployment |
| Spaniards | 42.2 /100 | #182 | Average 5.3% |
| Brazilians | 40.2 /100 | #183 | Average 5.3% |
| Assyrians/Chaldeans/Syriacs | 39.2 /100 | #184 | Fair 5.3% |
| Immigrants | Thailand | 38.9 /100 | #185 | Fair 5.3% |
| Immigrants | Uganda | 37.8 /100 | #186 | Fair 5.3% |
| Costa Ricans | 37.4 /100 | #187 | Fair 5.3% |
| Alsatians | 37.0 /100 | #188 | Fair 5.3% |
| Immigrants | Belarus | 35.6 /100 | #189 | Fair 5.3% |
| Arabs | 35.3 /100 | #190 | Fair 5.3% |
| Somalis | 34.0 /100 | #191 | Fair 5.3% |
| South Americans | 33.9 /100 | #192 | Fair 5.3% |
| Immigrants | Somalia | 33.8 /100 | #193 | Fair 5.3% |
| Immigrants | Laos | 30.9 /100 | #194 | Fair 5.3% |
| Immigrants | Southern Europe | 30.9 /100 | #195 | Fair 5.3% |
| Peruvians | 29.9 /100 | #196 | Fair 5.3% |
Demographics Similar to Slavs by Unemployment
In terms of unemployment, the demographic groups most similar to Slavs are New Zealander (4.9%, a difference of 0.030%), Slovak (4.9%, a difference of 0.070%), Immigrants from North America (4.9%, a difference of 0.090%), Immigrants from Canada (4.9%, a difference of 0.22%), and Serbian (4.9%, a difference of 0.24%).
| Demographics | Rating | Rank | Unemployment |
| Cambodians | 99.0 /100 | #61 | Exceptional 4.9% |
| Icelanders | 98.9 /100 | #62 | Exceptional 4.9% |
| Immigrants | Bulgaria | 98.9 /100 | #63 | Exceptional 4.9% |
| Italians | 98.9 /100 | #64 | Exceptional 4.9% |
| Immigrants | Canada | 98.8 /100 | #65 | Exceptional 4.9% |
| Slovaks | 98.7 /100 | #66 | Exceptional 4.9% |
| New Zealanders | 98.6 /100 | #67 | Exceptional 4.9% |
| Slavs | 98.6 /100 | #68 | Exceptional 4.9% |
| Immigrants | North America | 98.5 /100 | #69 | Exceptional 4.9% |
| Serbians | 98.4 /100 | #70 | Exceptional 4.9% |
| Immigrants | Japan | 98.3 /100 | #71 | Exceptional 4.9% |
| Burmese | 98.3 /100 | #72 | Exceptional 4.9% |
| Paraguayans | 98.3 /100 | #73 | Exceptional 4.9% |
| Immigrants | Northern Europe | 98.2 /100 | #74 | Exceptional 4.9% |
| Turks | 98.0 /100 | #75 | Exceptional 4.9% |