Iraqi vs Slavic Unemployment
COMPARE
Iraqi
Slavic
Unemployment
Unemployment Comparison
Iraqis
Slavs
5.4%
UNEMPLOYMENT
18.1/ 100
METRIC RATING
211th/ 347
METRIC RANK
4.9%
UNEMPLOYMENT
98.6/ 100
METRIC RATING
68th/ 347
METRIC RANK
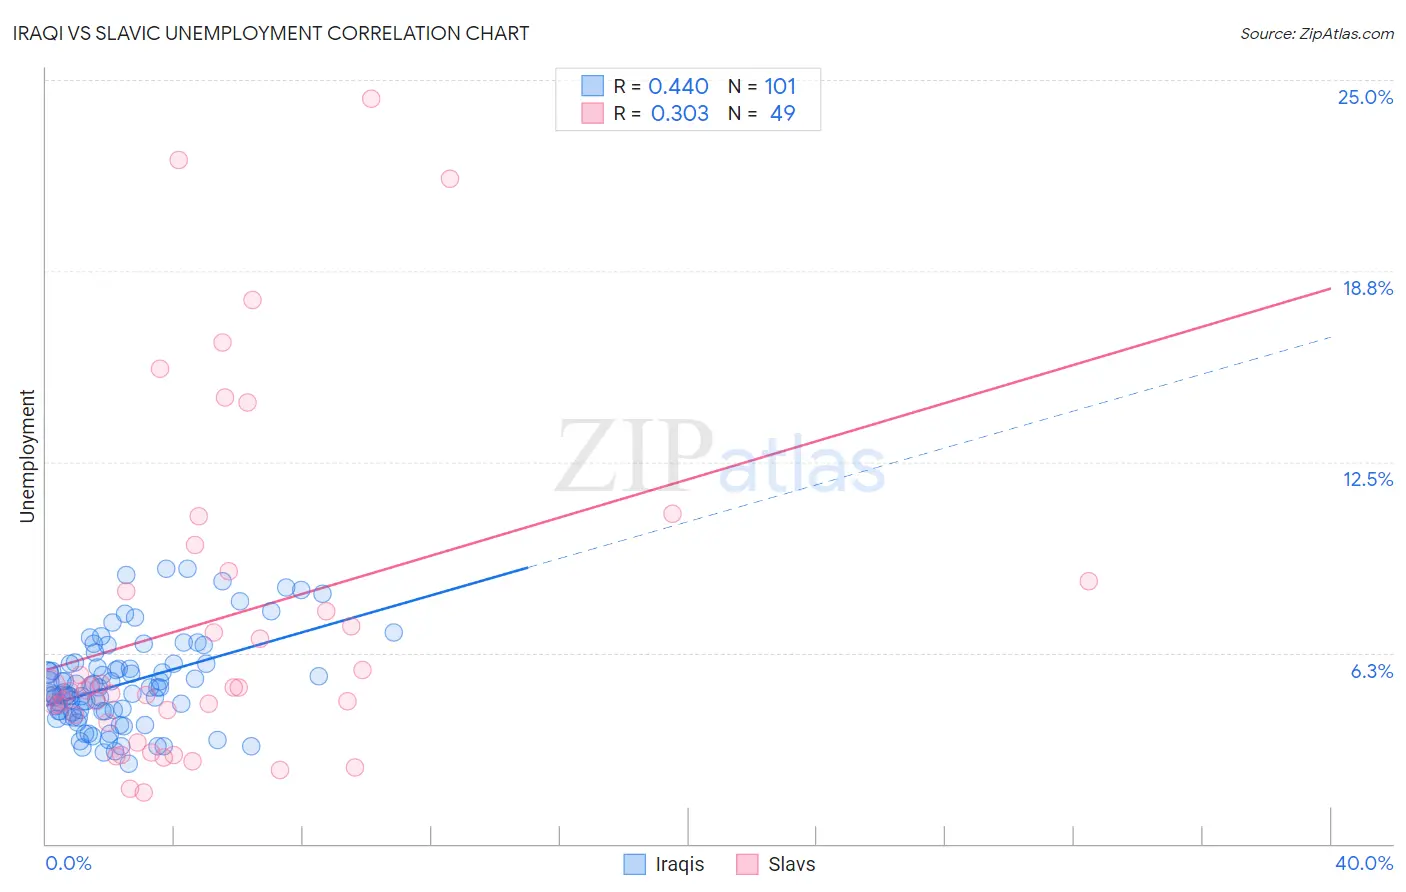
Iraqi vs Slavic Unemployment Correlation Chart
The statistical analysis conducted on geographies consisting of 170,626,447 people shows a moderate positive correlation between the proportion of Iraqis and unemployment in the United States with a correlation coefficient (R) of 0.440 and weighted average of 5.4%. Similarly, the statistical analysis conducted on geographies consisting of 270,672,053 people shows a mild positive correlation between the proportion of Slavs and unemployment in the United States with a correlation coefficient (R) of 0.303 and weighted average of 4.9%, a difference of 9.5%.
Unemployment Correlation Summary
| Measurement | Iraqi | Slavic |
| Minimum | 2.6% | 1.7% |
| Maximum | 9.0% | 24.4% |
| Range | 6.4% | 22.7% |
| Mean | 5.2% | 7.3% |
| Median | 4.9% | 5.1% |
| Interquartile 25% (IQ1) | 4.3% | 4.1% |
| Interquartile 75% (IQ3) | 5.9% | 8.7% |
| Interquartile Range (IQR) | 1.6% | 4.7% |
| Standard Deviation (Sample) | 1.5% | 5.6% |
| Standard Deviation (Population) | 1.4% | 5.5% |
Similar Demographics by Unemployment
Demographics Similar to Iraqis by Unemployment
In terms of unemployment, the demographic groups most similar to Iraqis are Ugandan (5.4%, a difference of 0.010%), Immigrants from Iraq (5.4%, a difference of 0.050%), Immigrants from Iran (5.4%, a difference of 0.070%), Portuguese (5.4%, a difference of 0.10%), and Creek (5.4%, a difference of 0.13%).
| Demographics | Rating | Rank | Unemployment |
| Immigrants | Ukraine | 24.9 /100 | #204 | Fair 5.3% |
| Native Hawaiians | 24.1 /100 | #205 | Fair 5.3% |
| Immigrants | Peru | 22.7 /100 | #206 | Fair 5.4% |
| Creek | 19.4 /100 | #207 | Poor 5.4% |
| Portuguese | 19.0 /100 | #208 | Poor 5.4% |
| Immigrants | Iran | 18.8 /100 | #209 | Poor 5.4% |
| Immigrants | Iraq | 18.6 /100 | #210 | Poor 5.4% |
| Iraqis | 18.1 /100 | #211 | Poor 5.4% |
| Ugandans | 18.0 /100 | #212 | Poor 5.4% |
| Immigrants | Middle Africa | 15.3 /100 | #213 | Poor 5.4% |
| Immigrants | Costa Rica | 15.2 /100 | #214 | Poor 5.4% |
| Delaware | 14.7 /100 | #215 | Poor 5.4% |
| Immigrants | South America | 13.5 /100 | #216 | Poor 5.4% |
| Immigrants | Albania | 13.5 /100 | #217 | Poor 5.4% |
| Choctaw | 12.7 /100 | #218 | Poor 5.4% |
Demographics Similar to Slavs by Unemployment
In terms of unemployment, the demographic groups most similar to Slavs are New Zealander (4.9%, a difference of 0.030%), Slovak (4.9%, a difference of 0.070%), Immigrants from North America (4.9%, a difference of 0.090%), Immigrants from Canada (4.9%, a difference of 0.22%), and Serbian (4.9%, a difference of 0.24%).
| Demographics | Rating | Rank | Unemployment |
| Cambodians | 99.0 /100 | #61 | Exceptional 4.9% |
| Icelanders | 98.9 /100 | #62 | Exceptional 4.9% |
| Immigrants | Bulgaria | 98.9 /100 | #63 | Exceptional 4.9% |
| Italians | 98.9 /100 | #64 | Exceptional 4.9% |
| Immigrants | Canada | 98.8 /100 | #65 | Exceptional 4.9% |
| Slovaks | 98.7 /100 | #66 | Exceptional 4.9% |
| New Zealanders | 98.6 /100 | #67 | Exceptional 4.9% |
| Slavs | 98.6 /100 | #68 | Exceptional 4.9% |
| Immigrants | North America | 98.5 /100 | #69 | Exceptional 4.9% |
| Serbians | 98.4 /100 | #70 | Exceptional 4.9% |
| Immigrants | Japan | 98.3 /100 | #71 | Exceptional 4.9% |
| Burmese | 98.3 /100 | #72 | Exceptional 4.9% |
| Paraguayans | 98.3 /100 | #73 | Exceptional 4.9% |
| Immigrants | Northern Europe | 98.2 /100 | #74 | Exceptional 4.9% |
| Turks | 98.0 /100 | #75 | Exceptional 4.9% |