Immigrants from Belarus vs Spanish American Unemployment
COMPARE
Immigrants from Belarus
Spanish American
Unemployment
Unemployment Comparison
Immigrants from Belarus
Spanish Americans
5.3%
UNEMPLOYMENT
35.6/ 100
METRIC RATING
189th/ 347
METRIC RANK
5.6%
UNEMPLOYMENT
2.0/ 100
METRIC RATING
242nd/ 347
METRIC RANK
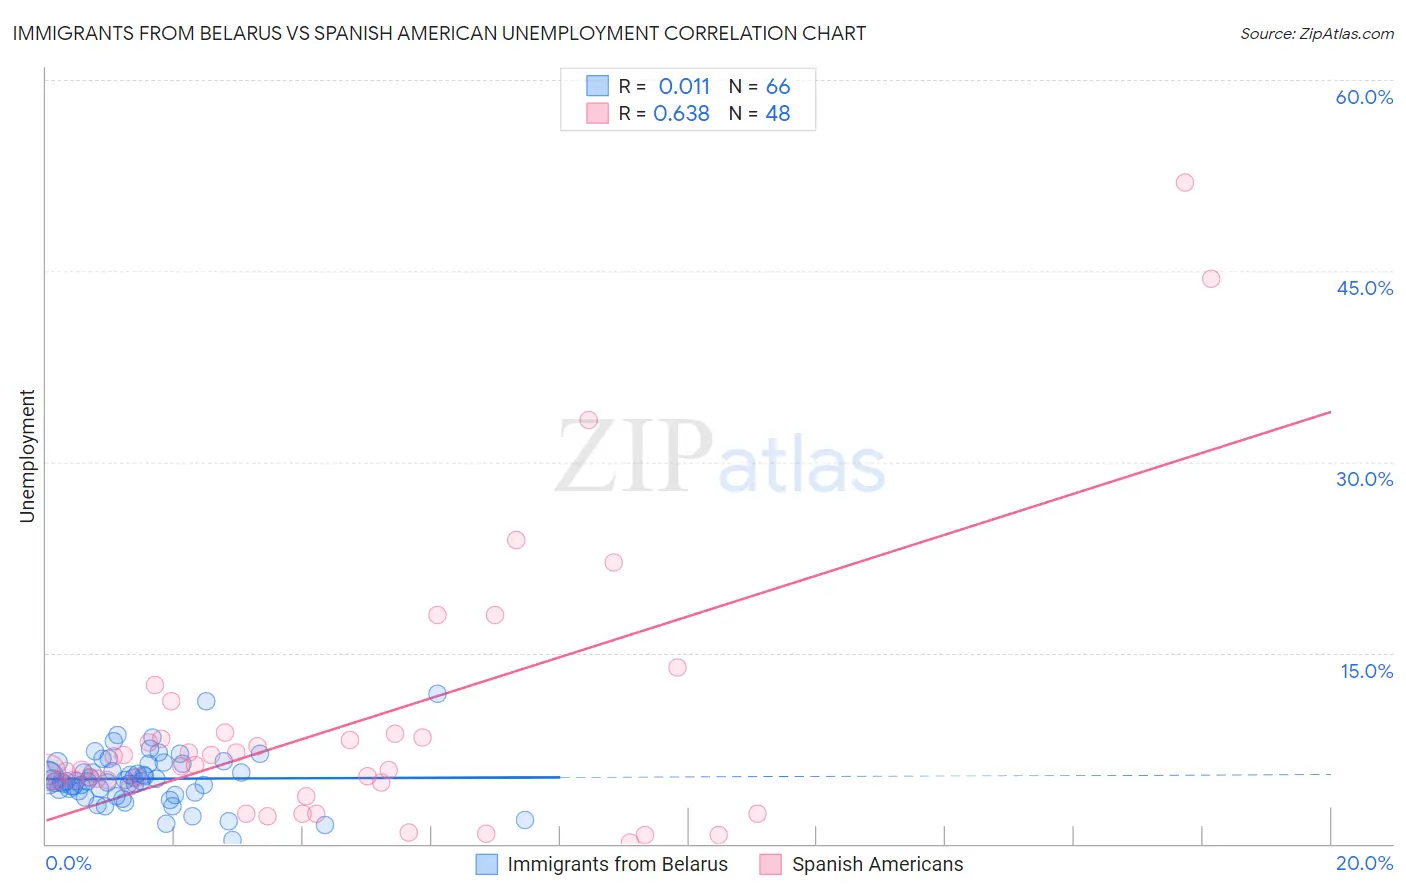
Immigrants from Belarus vs Spanish American Unemployment Correlation Chart
The statistical analysis conducted on geographies consisting of 150,154,457 people shows no correlation between the proportion of Immigrants from Belarus and unemployment in the United States with a correlation coefficient (R) of 0.011 and weighted average of 5.3%. Similarly, the statistical analysis conducted on geographies consisting of 103,137,220 people shows a significant positive correlation between the proportion of Spanish Americans and unemployment in the United States with a correlation coefficient (R) of 0.638 and weighted average of 5.6%, a difference of 5.0%.
Unemployment Correlation Summary
| Measurement | Immigrants from Belarus | Spanish American |
| Minimum | 0.30% | 0.10% |
| Maximum | 11.8% | 51.9% |
| Range | 11.5% | 51.8% |
| Mean | 5.1% | 9.2% |
| Median | 4.9% | 5.9% |
| Interquartile 25% (IQ1) | 4.2% | 4.7% |
| Interquartile 75% (IQ3) | 6.3% | 8.5% |
| Interquartile Range (IQR) | 2.1% | 3.8% |
| Standard Deviation (Sample) | 2.0% | 10.4% |
| Standard Deviation (Population) | 2.0% | 10.3% |
Similar Demographics by Unemployment
Demographics Similar to Immigrants from Belarus by Unemployment
In terms of unemployment, the demographic groups most similar to Immigrants from Belarus are Arab (5.3%, a difference of 0.020%), Alsatian (5.3%, a difference of 0.090%), Somali (5.3%, a difference of 0.11%), South American (5.3%, a difference of 0.11%), and Costa Rican (5.3%, a difference of 0.12%).
| Demographics | Rating | Rank | Unemployment |
| Spaniards | 42.2 /100 | #182 | Average 5.3% |
| Brazilians | 40.2 /100 | #183 | Average 5.3% |
| Assyrians/Chaldeans/Syriacs | 39.2 /100 | #184 | Fair 5.3% |
| Immigrants | Thailand | 38.9 /100 | #185 | Fair 5.3% |
| Immigrants | Uganda | 37.8 /100 | #186 | Fair 5.3% |
| Costa Ricans | 37.4 /100 | #187 | Fair 5.3% |
| Alsatians | 37.0 /100 | #188 | Fair 5.3% |
| Immigrants | Belarus | 35.6 /100 | #189 | Fair 5.3% |
| Arabs | 35.3 /100 | #190 | Fair 5.3% |
| Somalis | 34.0 /100 | #191 | Fair 5.3% |
| South Americans | 33.9 /100 | #192 | Fair 5.3% |
| Immigrants | Somalia | 33.8 /100 | #193 | Fair 5.3% |
| Immigrants | Laos | 30.9 /100 | #194 | Fair 5.3% |
| Immigrants | Southern Europe | 30.9 /100 | #195 | Fair 5.3% |
| Peruvians | 29.9 /100 | #196 | Fair 5.3% |
Demographics Similar to Spanish Americans by Unemployment
In terms of unemployment, the demographic groups most similar to Spanish Americans are Tlingit-Haida (5.6%, a difference of 0.0%), Cree (5.6%, a difference of 0.35%), Immigrants (5.5%, a difference of 0.36%), Immigrants from Western Asia (5.5%, a difference of 0.45%), and Marshallese (5.6%, a difference of 0.64%).
| Demographics | Rating | Rank | Unemployment |
| Immigrants | Panama | 3.4 /100 | #235 | Tragic 5.5% |
| Immigrants | Cambodia | 3.3 /100 | #236 | Tragic 5.5% |
| Moroccans | 3.2 /100 | #237 | Tragic 5.5% |
| Immigrants | Western Asia | 2.8 /100 | #238 | Tragic 5.5% |
| Immigrants | Immigrants | 2.6 /100 | #239 | Tragic 5.5% |
| Cree | 2.6 /100 | #240 | Tragic 5.6% |
| Tlingit-Haida | 2.0 /100 | #241 | Tragic 5.6% |
| Spanish Americans | 2.0 /100 | #242 | Tragic 5.6% |
| Marshallese | 1.3 /100 | #243 | Tragic 5.6% |
| Dutch West Indians | 1.2 /100 | #244 | Tragic 5.6% |
| French American Indians | 1.2 /100 | #245 | Tragic 5.6% |
| Bermudans | 1.1 /100 | #246 | Tragic 5.6% |
| Immigrants | Cameroon | 1.0 /100 | #247 | Tragic 5.6% |
| Liberians | 0.9 /100 | #248 | Tragic 5.6% |
| Cajuns | 0.8 /100 | #249 | Tragic 5.6% |