Cuban vs Slavic Unemployment
COMPARE
Cuban
Slavic
Unemployment
Unemployment Comparison
Cubans
Slavs
4.7%
UNEMPLOYMENT
99.8/ 100
METRIC RATING
28th/ 347
METRIC RANK
4.9%
UNEMPLOYMENT
98.6/ 100
METRIC RATING
68th/ 347
METRIC RANK
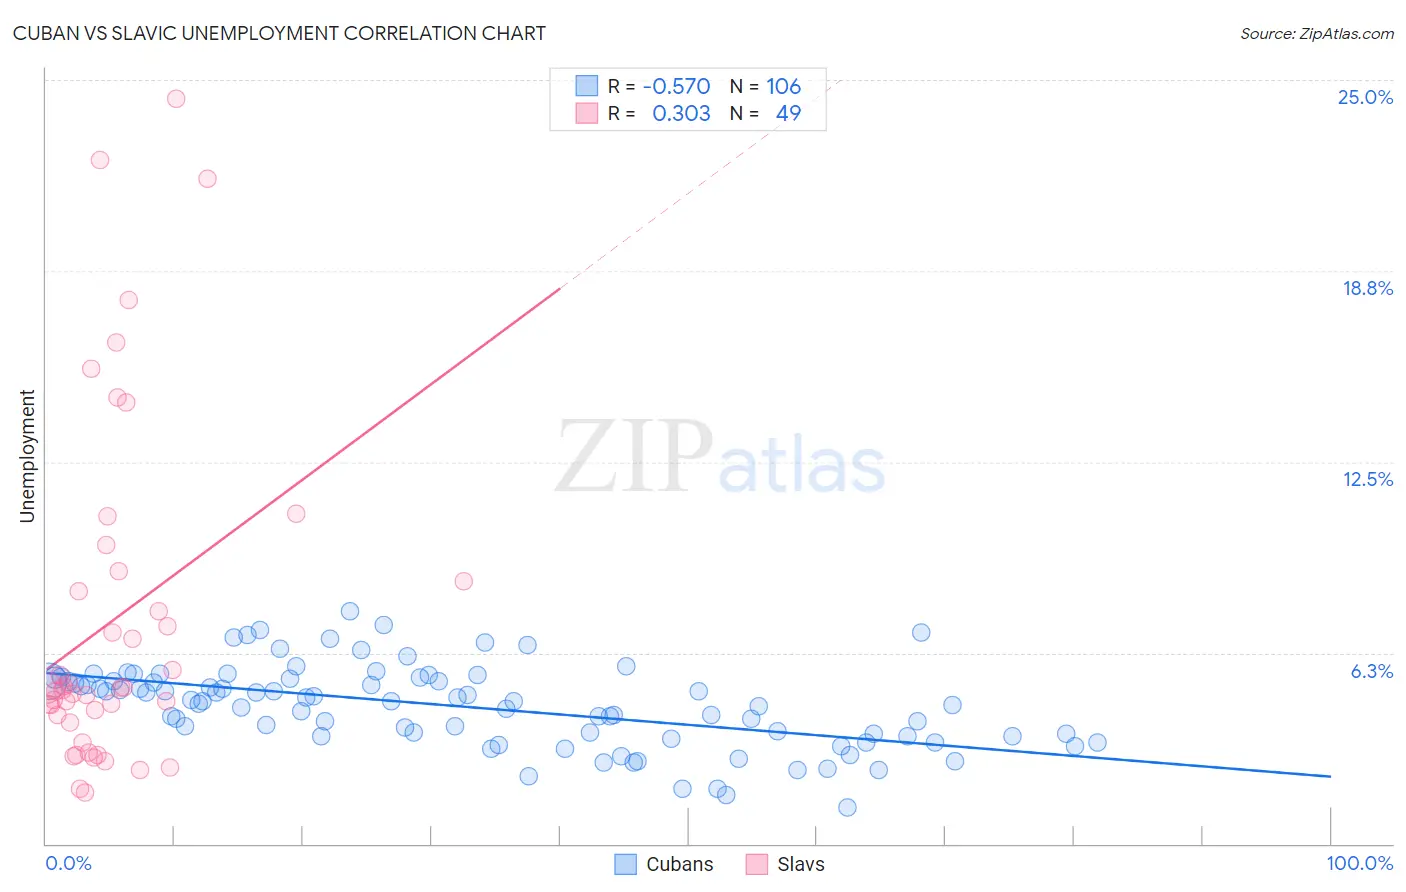
Cuban vs Slavic Unemployment Correlation Chart
The statistical analysis conducted on geographies consisting of 448,752,139 people shows a substantial negative correlation between the proportion of Cubans and unemployment in the United States with a correlation coefficient (R) of -0.570 and weighted average of 4.7%. Similarly, the statistical analysis conducted on geographies consisting of 270,672,053 people shows a mild positive correlation between the proportion of Slavs and unemployment in the United States with a correlation coefficient (R) of 0.303 and weighted average of 4.9%, a difference of 3.7%.
Unemployment Correlation Summary
| Measurement | Cuban | Slavic |
| Minimum | 1.2% | 1.7% |
| Maximum | 7.6% | 24.4% |
| Range | 6.4% | 22.7% |
| Mean | 4.5% | 7.3% |
| Median | 4.7% | 5.1% |
| Interquartile 25% (IQ1) | 3.5% | 4.1% |
| Interquartile 75% (IQ3) | 5.3% | 8.7% |
| Interquartile Range (IQR) | 1.8% | 4.7% |
| Standard Deviation (Sample) | 1.3% | 5.6% |
| Standard Deviation (Population) | 1.3% | 5.5% |
Similar Demographics by Unemployment
Demographics Similar to Cubans by Unemployment
In terms of unemployment, the demographic groups most similar to Cubans are Polish (4.7%, a difference of 0.12%), Finnish (4.7%, a difference of 0.32%), Irish (4.8%, a difference of 0.36%), Croatian (4.8%, a difference of 0.38%), and Zimbabwean (4.8%, a difference of 0.48%).
| Demographics | Rating | Rank | Unemployment |
| Welsh | 99.9 /100 | #21 | Exceptional 4.7% |
| Thais | 99.9 /100 | #22 | Exceptional 4.7% |
| British | 99.9 /100 | #23 | Exceptional 4.7% |
| Venezuelans | 99.9 /100 | #24 | Exceptional 4.7% |
| Latvians | 99.9 /100 | #25 | Exceptional 4.7% |
| Bulgarians | 99.9 /100 | #26 | Exceptional 4.7% |
| Finns | 99.9 /100 | #27 | Exceptional 4.7% |
| Cubans | 99.8 /100 | #28 | Exceptional 4.7% |
| Poles | 99.8 /100 | #29 | Exceptional 4.7% |
| Irish | 99.8 /100 | #30 | Exceptional 4.8% |
| Croatians | 99.8 /100 | #31 | Exceptional 4.8% |
| Zimbabweans | 99.8 /100 | #32 | Exceptional 4.8% |
| Sudanese | 99.8 /100 | #33 | Exceptional 4.8% |
| Immigrants | Bolivia | 99.8 /100 | #34 | Exceptional 4.8% |
| Scotch-Irish | 99.8 /100 | #35 | Exceptional 4.8% |
Demographics Similar to Slavs by Unemployment
In terms of unemployment, the demographic groups most similar to Slavs are New Zealander (4.9%, a difference of 0.030%), Slovak (4.9%, a difference of 0.070%), Immigrants from North America (4.9%, a difference of 0.090%), Immigrants from Canada (4.9%, a difference of 0.22%), and Serbian (4.9%, a difference of 0.24%).
| Demographics | Rating | Rank | Unemployment |
| Cambodians | 99.0 /100 | #61 | Exceptional 4.9% |
| Icelanders | 98.9 /100 | #62 | Exceptional 4.9% |
| Immigrants | Bulgaria | 98.9 /100 | #63 | Exceptional 4.9% |
| Italians | 98.9 /100 | #64 | Exceptional 4.9% |
| Immigrants | Canada | 98.8 /100 | #65 | Exceptional 4.9% |
| Slovaks | 98.7 /100 | #66 | Exceptional 4.9% |
| New Zealanders | 98.6 /100 | #67 | Exceptional 4.9% |
| Slavs | 98.6 /100 | #68 | Exceptional 4.9% |
| Immigrants | North America | 98.5 /100 | #69 | Exceptional 4.9% |
| Serbians | 98.4 /100 | #70 | Exceptional 4.9% |
| Immigrants | Japan | 98.3 /100 | #71 | Exceptional 4.9% |
| Burmese | 98.3 /100 | #72 | Exceptional 4.9% |
| Paraguayans | 98.3 /100 | #73 | Exceptional 4.9% |
| Immigrants | Northern Europe | 98.2 /100 | #74 | Exceptional 4.9% |
| Turks | 98.0 /100 | #75 | Exceptional 4.9% |